
Period over Period Looker Guide : How to Compare Metrics Across Time (YoY, MoM, QoQ)
- G Harini Ganga

- Nov 19, 2025
- 3 min read
Why Time-Based Comparisons Matter
Seeing your current performance is useful, but it does not explain growth, momentum, or direction. To understand whether your business is improving, stabilizing, or declining, you need to compare today’s numbers with past performance.

This is where Period-over-Period (PoP) analysis in Looker becomes essential. Instead of relying on manual spreadsheets or external SQL queries, Looker can compute Month-over-Month (MoM), Quarter-over-Quarter (QoQ), and Year-over-Year (YoY) comparisons directly inside an Explore.
Whether you are comparing this month’s sales to last month or this year’s revenue to the previous year, PoP analysis provides context that single values cannot capture.
What Period-over-Period Analysis Is
Period-over-Period analysis measures the change in a metric between two equivalent time periods. Looker uses your time dimensions to align current and previous periods automatically.
Examples of PoP comparisons include:
Current month vs previous month
Current quarter vs previous quarter
Current year vs previous year
Year-to-date progress vs the same period last year
Looker automatically calculates:
Current period value
Previous period value
Absolute difference
Percentage change
This produces a complete view of performance without manual calculations.
Why PoP Measures Matter
Raw data only tells you what happened. Time-based comparisons tell you what is changing. PoP measures help teams answer questions like:
Are we improving or declining?
How does this month compare to the last?
Are we growing faster than last year?
Is performance on track for targets?
PoP adds clarity by revealing trend momentum rather than isolated values. It also reduces operational overhead because Looker handles period alignment, time intelligence, and historical matching automatically.
How to Build Period-over-Period Measures in Looker
PoP measures work by defining a base metric, a time dimension, and a comparison period. Once these are aligned in LookML, Looker performs the calculations across all equivalent time periods.
Step 1: Define the Measure in LookML
Every PoP measure begins with:
A base metric (for example, orders.count)
A time field that represents the period being compared
Key LookML parameters include:
based_on: The metric being analyzed (for example, total orders).
based_on_time: The time dimension used to align periods (for example, order date).
period: The comparison interval such as year, quarter, month, or week.
kind: The calculation type, such as previous value, difference, or percentage change.
Looker then generates the full set of PoP values automatically.
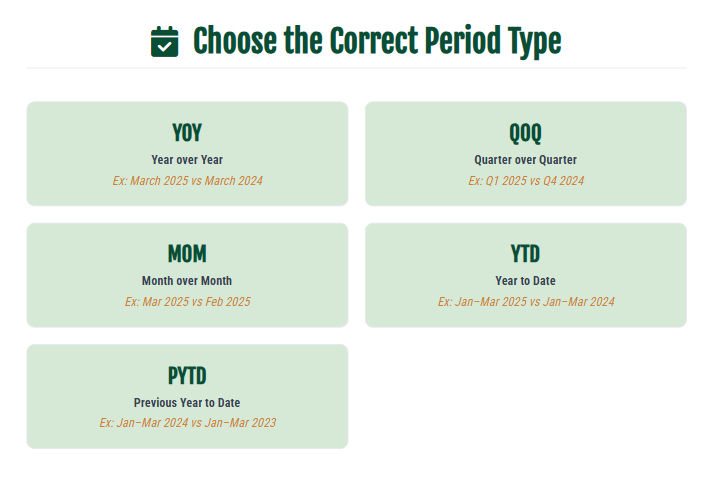
Step 2: Choose the Correct Period Type
Different types of period comparisons are used depending on reporting needs. Common examples include:
Period Type | What It Compares | Example |
YOY (Year over Year) | Current year vs previous year | March 2025 vs March 2024 |
QTD (Quarter to Date) | Current quarter to previous quarter | Q1 2025 vs Q4 2024 |
MTD (Month to Date) | Current month to previous month | March 2025 vs February 2025 |
YTD (Year to Date) | Current year-to-date vs previous | Jan–Mar 2025 vs Jan–Mar 2024 |
PYTD (Previous Year to Date) | Last year’s progress vs earlier year | Jan–Mar 2024 vs Jan–Mar 2023 |
Step 3: Use value_to_date for Matching Dates Across Years
If you want comparisons up to the same point in time across years, enable:
value_to_date: yes
For example, if today is June 6, 2025, Looker will compare data from:
January 1 to June 6, 2025 with
January 1 to June 6, 2024
This is essential for accurate Year-to-Date and similar analyses.
Step 4: Visualize Period-over-Period Results
The clearest way to present PoP measures is through table visualizations that show:
Current period value
Previous period value
Difference
Percentage change
Line charts or bar charts also work well as long as the axis clearly indicates period alignment, such as comparing 2025 vs 2024.
Example Use Cases Across Teams

PoP analysis is valuable across many business functions.
Revenue and Sales (YOY)
Track annual growth and identify whether performance is improving year over year.
Marketing (MTD)
Measure changes in ad performance, conversions, or spend from month to month.
Operations (QTD)
Analyze factory output, supply chain metrics, or production efficiency across quarters.
Customer Success (YTD)
Monitor churn, retention, or support ticket trends compared to last year.
In each case, Period-over-Period measures reveal the direction and momentum of performance.
Period-over-Period measures in Looker make trend analysis simple and reliable. Instead of exporting data or creating manual comparisons, analysts can evaluate performance changes directly within an Explore.
Whether your goal is to understand YoY growth, monitor MoM shifts, or measure quarterly progress, PoP analysis enables continuous performance tracking. It helps teams focus not only on where they stand today but on how they are evolving over time. Understanding change is often more valuable than knowing the absolute number, and Looker provides a straightforward way to measure that change.


Comments