
Recreate Tableau Dashboards in Looker - Practical Design Tips & Best Practices
- SquareShift Content Team

- Aug 11, 2025
- 4 min read
Updated: Sep 11, 2025
Migrating from Tableau to Looker is far more than a simple export-and-import exercise. It’s a strategic opportunity to recreate Tableau dashboards in Looker in a way that keeps the analytical core of your reporting intact, while also improving speed, clarity, and user experience. For many teams, this shift doesn’t just maintain the old dashboards, it results in cleaner, faster, and more scalable reporting.
Table of Contents
1.What Changes Visually When You Recreate Tableau Dashboards in Looker |
2.How Interactivity and Filtering Behave Differently |
3.Preserving Analytical Intent, Even if Layouts Change |
4.Avoiding Common Pitfalls When Recreating Dashboards |
5.Why Dashboards Often Get Better After Migration |
6.Make the Most of Your Migration |
What Changes Visually When You Recreate Tableau Dashboards in Looker
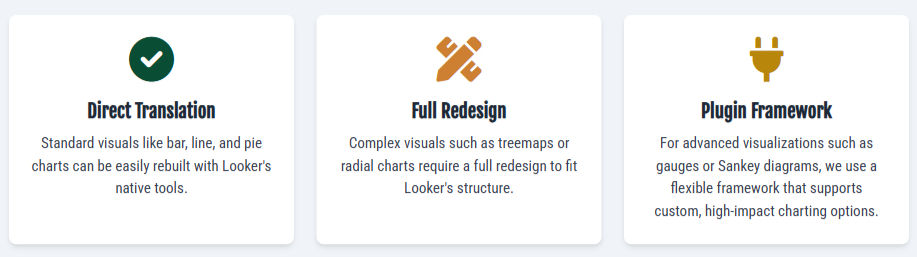
Some dashboard components make the move with almost no friction. Bar charts, line charts, and pie charts can be rebuilt using Looker’s native visualization tools, ensuring your familiar metrics still look and feel consistent.
Other visuals require a full redesign. Treemaps, radial charts, and other complex Tableau visuals often need to be reconstructed from scratch in Looker. This is actually a perfect moment to streamline - removing excess visuals and keeping only what drives meaningful decision-making.
For cases where neither native visuals nor simplification is enough, Looker dashboard recreation can tap into its plugin framework.
How Interactivity and Filtering Behave Differently
When recreating Tableau dashboards in Looker, interactivity follows the same goals but works differently under the hood. Tableau’s filters, sets, and parameters often allow spontaneous adjustments, but Looker’s approach is more deliberate, defining behaviours in LookML before exposing them to the end user.
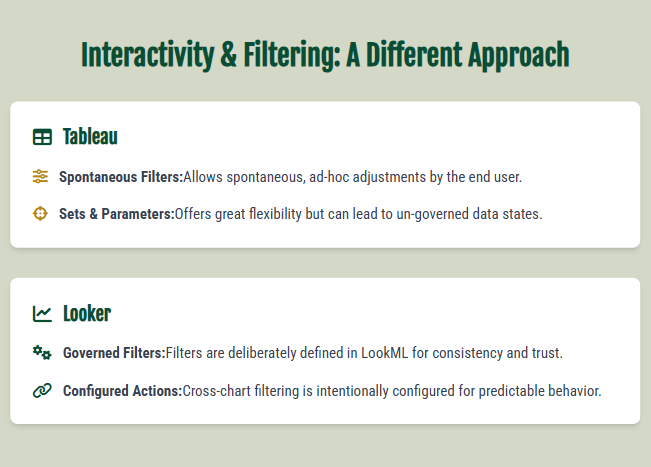
Conditional filters are written into the model first to ensure governed data subsets. Cross-chart filtering is fully possible in Looker - a click on one chart can update others, but it’s enabled through intentional configuration. Parameters require predefined values, so planning them during migration is crucial. Even set-based actions from Tableau can be modelled in LookML, providing similar capability with added stability.
Preserving Analytical Intent, Even if Layouts Change
A frequent concern when teams migrate Tableau dashboards to Looker is losing the original dashboard flow. While pixel-perfect layouts may shift, Looker’s tile system makes it easy to keep your top KPIs and charts front and center. Contextual text tiles and labels help preserve the narrative, guiding users through the data story just as effectively as before.
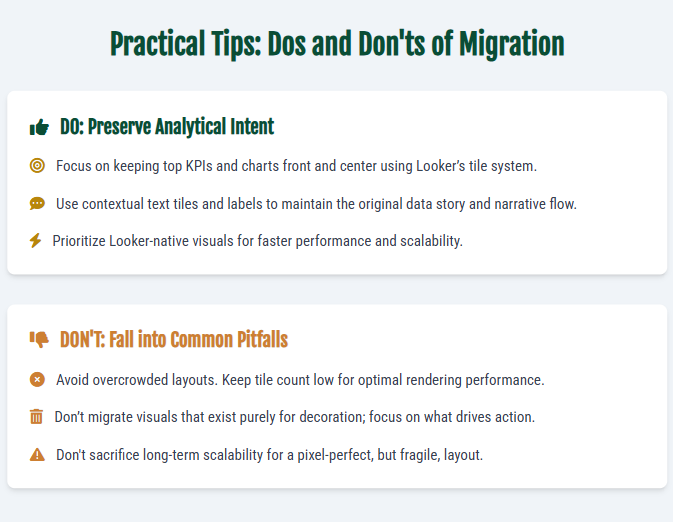
Using Looker-native visuals where possible ensures faster performance. For visuals that require more complexity, custom plugins replicate the Tableau experience without sacrificing load times or scaling capability. The result is a dashboard that delivers the same insight, sometimes even more effectively in its new environment.
Avoiding Common Pitfalls When Recreating Tableau Dashboards in Looker
We’ve seen many migrations falter due to overcrowded layouts, sluggish performance, and over-stylized visuals that don’t translate well. During Looker dashboard recreation, we focus on reducing tile count to keep performance high.
We also avoid bringing over visuals that exist purely for decoration. Instead, we keep what delivers clear, actionable insights. Every rebuild is designed with scalability in mind, ensuring dashboards perform well today and continue to do so as your datasets grow.
Why Dashboards Often Get Better After Migration
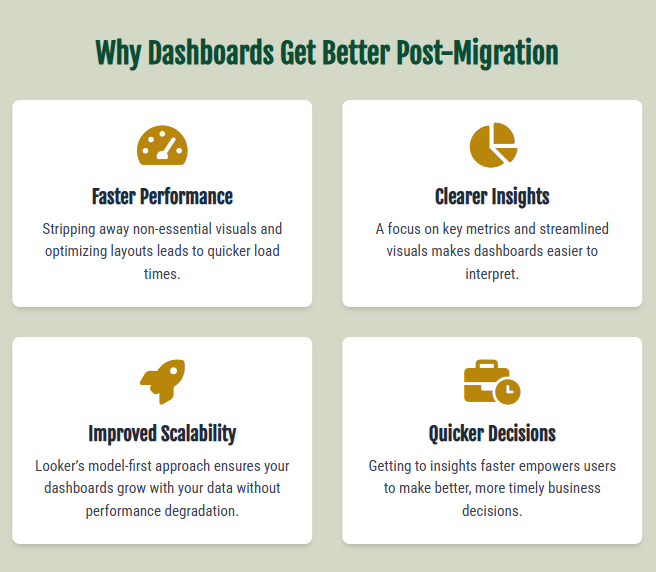
The process of recreating Tableau dashboards in Looker often produces something stronger than the original. Stripping away non-essential visuals, tightening layouts, and optimising performance can make the dashboard faster to load and easier to interpret. Users get to insights sooner, which means better decisions, faster.
Make the Most of Your Migration
If you’re planning to migrate Tableau dashboards to Looker, see it as more than just a conversion project. It’s a rare opportunity to reimagine your dashboards for speed, clarity, and long-term scalability.
Our team specialises in translating even the most complex Tableau visuals into Looker dashboards that are cleaner, faster, and easier to use - all without losing the analytical intent you’ve built over time.
Will my Tableau dashboards look exactly the same in Looker?
Not necessarily. While common charts like bar, line, and pie charts will look familiar, complex visuals like treemaps or radial charts may need to be redesigned. The focus is on preserving the analytical intent and data story, even if the exact layout or visuals change.
How do filters and interactivity work differently in Looker?
Looker's approach is more deliberate and governed. While Tableau allows for spontaneous adjustments, Looker requires that conditional filters and parameters be defined in the LookML model first. This ensures greater stability and consistency across your data.
Will a migration fix my overcrowded dashboards and slow load times?
Yes, it is a key opportunity to do so. The migration process allows you to strip away non-essential visuals, tighten layouts, and optimize the underlying data structure. The result is a dashboard that loads faster and is easier for your team to use, leading to quicker, more confident decision-making.
How can we be sure the new dashboards will be accurate and trusted by our team?
Our process includes a rigorous validation phase where we run side-by-side comparisons to ensure every KPI matches exactly. We then conduct user acceptance testing with your business teams to prove the new environment works, building confidence from day one.


Comments