
The Ultimate Guide to Tableau to Looker Migration
- SquareShift Content Team

- Aug 14, 2025
- 6 min read
Updated: Sep 11, 2025

Table of Contents
Why More Businesses Are Moving from Tableau to Looker
Your Tableau to Looker Migration Roadmap
Phase 1: Discovery and Strategic Planning
Phase 2: Building Your Looker Environment
Phase 3: Validation and User Adoption
Phase 4: Optimization and Growth
Common Migration Challenges (And How Our Accelerators Solve Them)
Why Squareshift for Your Migration
Your Next Steps
Why More Businesses Are Moving from Tableau to Looker
For years, Tableau has been a favorite for its drag-and-drop dashboard creation and powerful visuals. It has helped teams explore data quickly, test hypotheses, and present insights in compelling ways. But as organizations grow, so does the complexity of maintaining multiple dashboards, managing inconsistent calculations, and scaling analytics securely across departments.
Looker addresses these challenges with a semantic layer that standardizes metrics across the business, LookML for reusable modeling, and deep integration with cloud data warehouses like BigQuery, Snowflake, and Redshift.
This combination enables a level of governance and scalability that’s hard to achieve in a workbook-based environment.
A tableau to looker migration isn't just a platform switch, it's an opportunity to build analytics infrastructure that grows with your business. It is about aligning your BI platform with your long-term data strategy one that supports embedded analytics, automated governance, and a single source of truth.

Your Tableau to Looker Migration Roadmap
The most successful migrations follow a proven framework. We've structured this process into four distinct phases, each designed to minimize disruption while maximizing the value you get from day one.
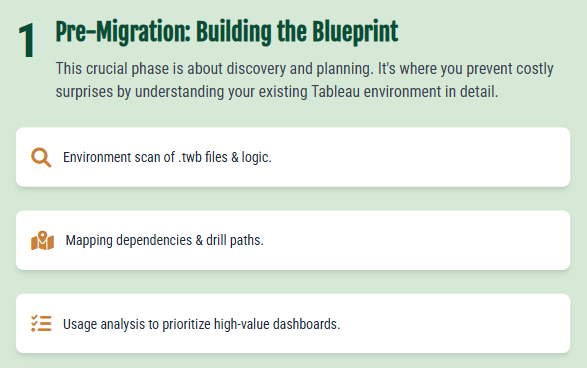
Phase 1: Discovery and Strategic Planning
Every successful migration starts with understanding exactly what you're working with. Many teams underestimate the complexity hidden in their current Tableau environment, scattered calculations, embedded logic, and dependencies that aren't immediately obvious.
What happens during discovery:
We conduct a comprehensive scan of your Tableau environment, analyzing workbook files to map out chart types, calculated fields, filters, parameters, and data relationships. This technical inventory reveals the true scope of your migration while identifying opportunities for improvement.
Usage patterns tell us which dashboards matter most to your business. Rather than migrating everything at once, we prioritize high-impact reports that deliver immediate value in Looker.
We also identify features that work differently between platforms. Certain Level of Detail expressions or custom visualizations might need alternative approaches in Looker. Better to plan these now than discover them mid-migration.
Success metrics for this phase:
Complete inventory of all dashboards, workbooks, and data sources
Usage analytics showing which reports drive business decisions
Clear migration priority list based on business impact
Technical complexity assessment for accurate timeline planning
Phase 2: Building Your Looker Environment

With a solid plan in place, we start recreating your Tableau experience in Looker. But we make it better. The goal is to build more maintainable, scalable analytics platform.
Component by component migration:
Every Tableau measure, dimension, and filter gets carefully mapped to its LookML equivalent.
This isn't a simple copy-paste operation. We're translating business logic into Looker's more structured approach.
Multiple definitions of the same metric get consolidated into single, governed measures. If your sales dashboard shows different revenue numbers than your executive report, this is where we fix that forever.
Visualization strategy:
Standard charts like bars, lines, and tables translate directly using Looker's native capabilities, often with improved performance. More complex visualizations might use Looker Marketplace extensions or custom solutions that fit your specific needs.
Performance optimization:
We structure your Looker Explores to return results quickly, using pre-aggregated tables for large datasets and optimizing joins at the modeling layer. Users get faster dashboards without sacrificing analytical depth.
Real example: A retail client had 150 Tableau dashboards, each calculating "customer lifetime value" slightly differently. After migration, one LookML measure powers every CLV calculation across the organization. No more conflicting numbers in meetings. Just consistent insights everyone can trust.
Phase 3: Validation and User Adoption

Migration success isn't measured by technical completion. It's measured by user adoption and trust in the new platform.
Ensuring data accuracy:
We run side-by-side comparisons between your original Tableau dashboards and new Looker versions, validating that every KPI matches exactly. This testing catches edge cases and ensures business continuity.
User acceptance testing involves your actual business teams, not just IT. We walk through real workflows to verify that daily operations run smoothly in the new environment.
Driving adoption:
The best way to build enthusiasm for Looker is showing immediate improvements. Users appreciate faster load times, cleaner interfaces, and the confidence that comes from consistent metrics.
We provide targeted training for different user types. Executives need different skills than data analysts. This role-based approach gets everyone productive quickly.
Change management includes sharing early wins in business terms: reduced time spent reconciling reports, faster access to insights, and stronger confidence in data-driven decisions.
Phase 4: Optimization and Growth
A successful migration sets the foundation for long-term analytics excellence. Once your dashboards are live, focus shifts to maintaining accuracy and enabling new capabilities.
Maintaining data integrity:
Regular validation checks against source data keep your metrics trustworthy. Automated monitoring catches issues before they affect business decisions.
Ongoing governance ensures new reports follow established standards, preventing the metric proliferation that may have prompted your migration in the first place.
Expanding capabilities:
Teams comfortable with LookML can build more sophisticated analyses than were practical in Tableau. The modeling layer makes complex business logic reusable across multiple reports.
Integration opportunities with other Google Cloud Platform services can unlock advanced analytics capabilities as your needs evolve.
Common Migration Challenges (And How We Handle Them)

Complex calculation logic: Tableau's Level of Detail expressions and nested calculations can be tricky to translate directly.
Our Migration Accelerator automatically detects these complex calculations and converts them into optimized LookML measures, preserving the business logic while improving performance.
Visualization gaps: Not every Tableau chart type has a direct Looker equivalent. Our accelerator identifies these gaps during assessment and provides a library of proven alternatives.
Multiple data source complexity: Tableau workbooks often blend data from various sources with intricate relationships. Our Assessment Accelerator maps these dependencies completely, then our Migration Accelerator consolidates the logic into clean LookML models that are easier to maintain and perform better.
Why Squareshift for Your Tableau to Looker Migration
As a Google Premier Partner and authorized Looker reseller, we understand both platforms deeply. Our team has guided organizations through complex data transformations, always focusing on business outcomes rather than just technical execution.
Our migration approach includes:
Assessment capabilities: Comprehensive analysis of your current Tableau environment, including automated parsing of workbook files and usage pattern analysis.
Migration expertise: Proven processes for translating Tableau logic into well-structured LookML models that perform better and scale more effectively.
Quality assurance: Rigorous testing protocols ensure every dashboard works correctly before your teams start using it.
We handle the technical complexity so you can focus on leveraging better analytics for business growth.
Your Next Steps
A Tableau to Looker migration represents more than a platform change. It's an investment in scalable, governed analytics that can support your organization's growth for years to come.
The right migration partner makes this transition smooth and successful. Our structured approach, combined with deep expertise in both platforms, ensures you get maximum value from day one.
Ready to explore what Looker can do for your organization? Let's discuss how a migration could strengthen your analytics capabilities while solving the governance and scalability challenges that matter most to your business.
Why are businesses moving from Tableau to Looker?
Businesses are moving from Tableau to Looker to solve scalability and governance issues. Looker’s semantic layer and LookML standardize metrics, ensuring a single source of truth across the organization, which is difficult to achieve in Tableau's workbook-based environment.
What are the biggest challenges in a migration?
Common challenges include translating complex calculations, addressing visualization gaps, and managing multiple data sources. SquareShift accelerators and expertise are used to automate the conversion of complex logic and consolidate data sources.
How does a successful BI migration benefit our business?
A successful migration provides a scalable analytics platform with strong data governance. It leads to faster dashboards, consistent metrics, and the ability to confidently use data for business growth, moving beyond a simple platform switch.
What makes Squareshift an expert in Tableau to Looker migrations?
Squareshift is a Google Premier Partner and authorized Looker reseller with deep expertise in both platforms.
Can you convert all Tableau dashboards to Looker?
Yes, it is possible to convert Tableau dashboards to Looker. Our migration process involves a comprehensive scan of your Tableau environment to map chart types, calculated fields, and data relationships. While standard visualizations translate directly, our experts identify and provide solutions for more complex or unique Tableau visualizations.


Comments