
Data visualization converts raw data into actionable insights. We previously examined D3.js, Chart.js, and Plotly.js. We analyzed their use cases, adoption metrics, and growth trends.
This article examines real-world applications of these libraries. We present case studies from companies using these tools. We analyze adoption trends to guide library selection for your project.
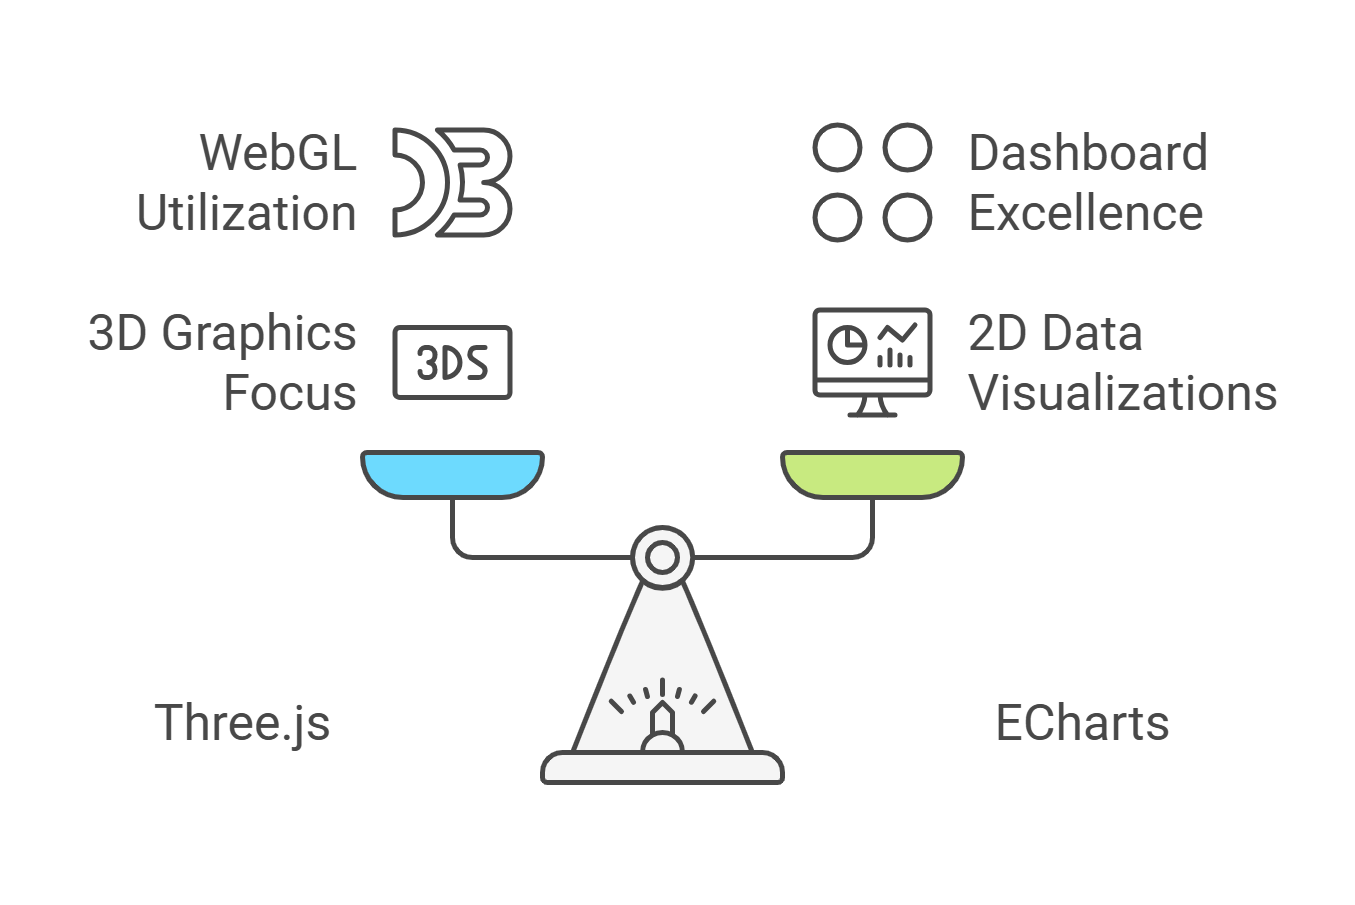
Three.js: Basic 3D Graphics Implementation
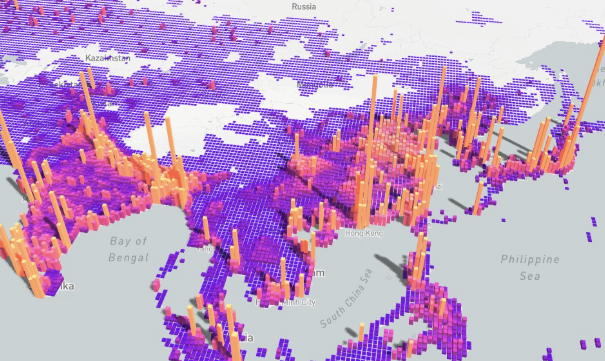
Three.js renders 3D graphics in web browsers. It uses WebGL to build interactive 3D visualizations.
Review the Three.js examples: https://threejs.org/examples/
Use Cases
Interactive 3D Models
- NASA uses Three.js to visualize space mission models and spacecraft designs.
- BMW: Uses Three.js to build virtual showrooms. Users explore 3D car models.
Augmented Reality (AR) and Virtual Reality (VR)
- Snapchat: Uses Three.js to render real-time AR filters and effects.
- Mozilla Hubs: Uses Three.js to create virtual meeting rooms and collaborative VR spaces.
Architectural and Urban Planning
- Autodesk uses Three.js to create interactive 3D building visualizations and structural models.
Gaming and Simulation
- Google uses Three.js for browser-based interactive experiments, such as the 3D Google Chrome Dino.
Scientific Data Visualization
- CERN uses Three.js to visualize particle collision simulations in 3D.
Product Customization
Nike uses Three.js to enable real-time 3D shoe customization previews.
IKEA uses the library in its AR app to display furniture placement within user homes.

Metrics and Growth
- Adoption: Common in industries requiring immersive 3D experiences, such as gaming, AR/VR, and architecture.
- GitHub stars exceed 94,000. This metric confirms strong community adoption and long-term stability.
- AR/VR and Web3.0 adoption continues to grow. Three.js supports the creation of immersive web experiences in these domains.
ECharts: Enterprise Visualization Framework
ECharts is a browser-based charting library. It supports interactive data visualization. The library supports dashboard construction and complex data representation.
Key capabilities include:
- Abundant chart types
- Large-scale data visualization
- Mobile optimization
- Multiple rendering methods
- Cross-platform support
- Interactive data exploration
- Multi-dimensional data support
- Dynamic data handling
- Special effects
- Enhanced 3D visualizations via WebGL
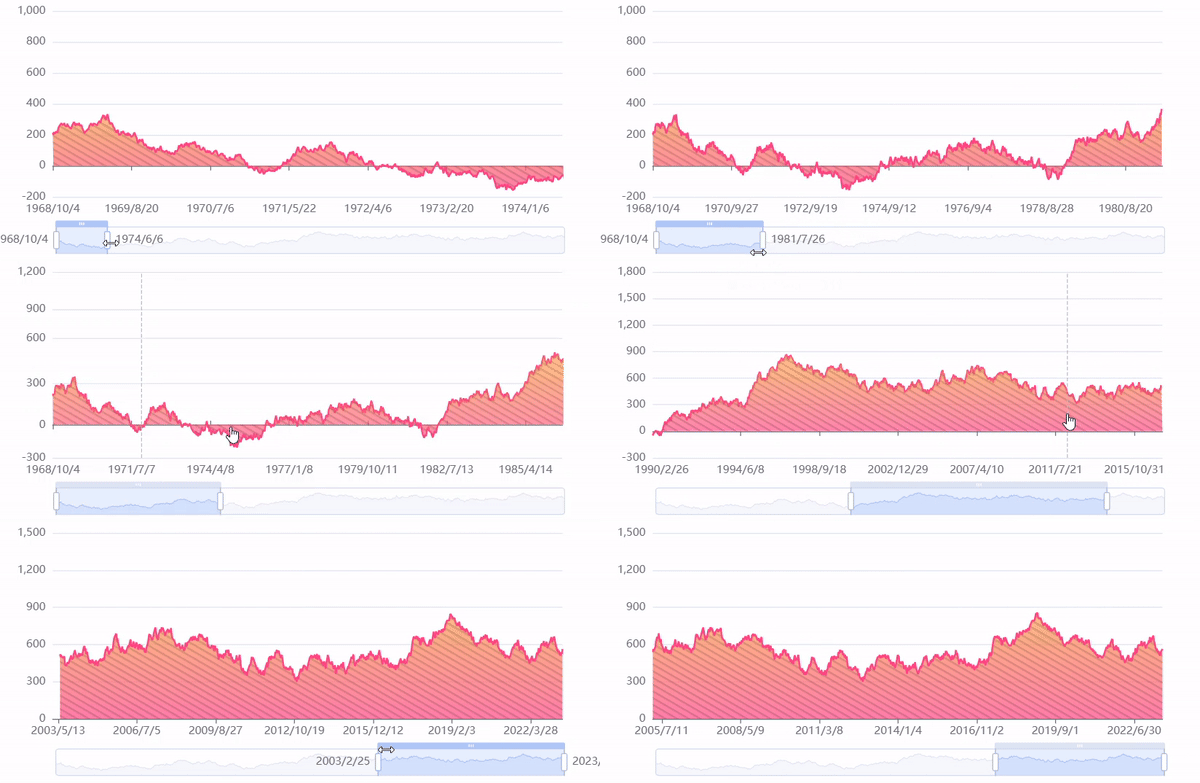
Reference: ECharts Examples - Line Chart
Use Cases
Enterprise Dashboards
- Alibaba: Uses ECharts for real-time performance analytics dashboards. Tracks sales and logistics.
Financial Analytics
- Tencent: Implements ECharts for interactive stock market analysis and real-time trading dashboards.
- Wealthfront: Uses ECharts for portfolio performance visualization in user-facing tools.
Geospatial Data Visualization
- World Health Organization (WHO): Uses ECharts to map global disease outbreaks and vaccination trends.
IoT Data Monitoring
- Xiaomi uses ECharts to display device performance metrics in smart home dashboards.
- Bosch uses ECharts for real-time IoT analytics and predictive maintenance tools.
Metrics and Growth
- Enterprise adoption: High volume of projects due to feature richness and data handling capacity.
- GitHub Stars: Over 57,000 stars indicate strong developer community adoption.
- Trend: Business applications rely on dashboards and analytics. ECharts remains a leading choice for large-scale data visualizations.
Conclusion
Three.js and ECharts demonstrate the versatility of JavaScript in visualization. Three.js supports immersive 3D experiences for gaming, AR/VR, and architecture. ECharts supports enterprise data visualization with interactive dashboards for analytics and IoT.