



01
KPIs and metrics are untrustworthy
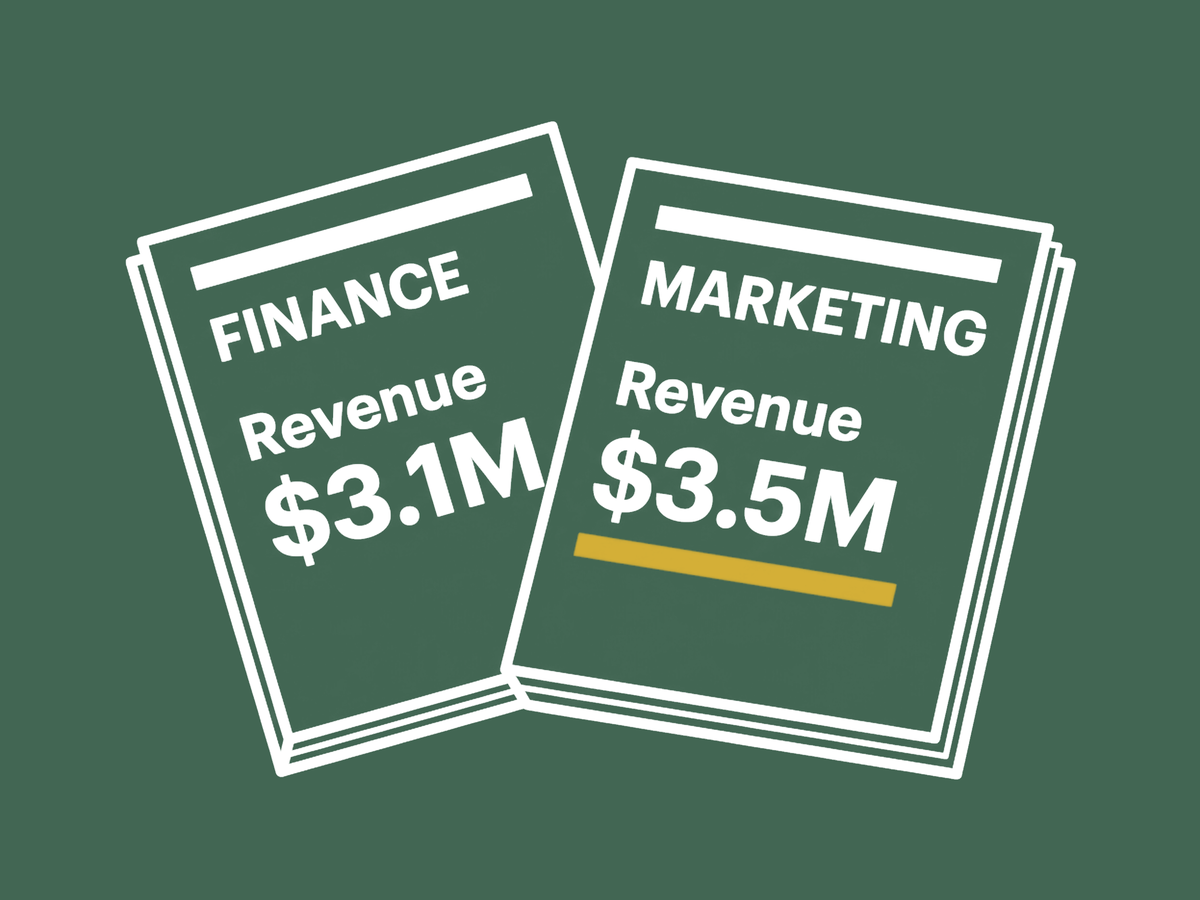
Revenue should mean one thing. But finance, marketing, and sales can still return different figures.


SquareShift builds Looker conversational analytics. Every answer resolves to your KPI definitions and stays inside your access controls, so the number in a chat matches the number on your dashboard.
30 minutes, on your own data model, not a slide deck.
01
Revenue should mean one thing. But finance, marketing, and sales can still return different figures.

02
The evidence sits in reports, documents, and systems. You have to find it, compare it, and collate it yourself.

03
You can explain what happened. You still cannot see the action that will prevent the next miss.
Decision intelligence closes the gap between the number and the next move.
The user asks one business question. The system finds the right data, applies the right definitions, and returns an answer with sources, calculations, and next actions.
Revenue is down this month. What caused it, and where can we regain momentum?
Price −6.1% · Volume −2.6% · Mix +0.8%
Ask in plain English, not SQL. Get back an answer resolved against your semantic layer, so the response is ready to act on, not just ready to read.
Every answer shows the exact view it queried and the measure it used.
A short summary first, then the numbers as a table, then the same numbers as a chart.
The governed view sits behind every answer, so any figure traces straight back to its source.
No second tool and no query builder. An empty slot invites a question, and the answer lands as a tile on the board.
A KPI, a chart, a comparison, or a table, added exactly where you asked for it.
Tiles resolve through the same semantic layer, so the board and the chat always agree.
Each tile keeps its question and re-runs it live, so the board stays current, never a snapshot.
When a number has to be defended rather than glanced at, open the workbook underneath it. The same governed figures, as a formal document.
Every governed answer carries a doorway straight into its workbook.
Headed sections with their own charts and tables, built to be quoted from, not scrolled through.
Every figure is computed by the same definitions the assistant already queries in chat.
Ask a new question in plain English. Save its answer as a dashboard tile when others need to track it. Both use the same metric definitions.
Live agents
“How have chain sales tracked month by month this year?”
Open demo →“Walk me through our FY26 bookings against quota - where did we win and where did we lose?”
Open demo →“Walk me through FY26 spend - where did we save and where did we leak?”
Open demo →“How many adults have poorly controlled diabetes, using an HbA1c threshold of 8 percent?”
Open demo →“Walk me through the first half of 2026 - what hit us, and how did we recover?”
Open demo →“Which lines drove scrap and downtime this quarter?”
In build“Where is portfolio risk concentrating against last year?”
In build“Which lanes missed service levels, and what did it cost?”
In buildCredentials
SquareShift brings governed BI, Google Cloud AI, Looker delivery, and Elastic GenAI credentials into the same applied-AI delivery system. See our Looker consulting and how a LookML semantic layer defines metrics. See Looker delivery in our case studies.
 Google Cloud Premier Partner
 Data Analytics Specialization
 Machine Learning Specialization
 Looker Consulting Partner
 Google Cloud Generative AI
 Elastic GenAI credential
Bring one decision-critical question. SquareShift connects the sources behind it, applies governed definitions, and shows leaders the answer they can act on.
Just want to talk to your data? Start there.