
AI-driven analytics in Looker adds a conversational layer to Looker's governed data models, so business users ask questions in plain language and get answers built on the same trusted definitions and metrics. Businesses historically used dashboards to track performance. Dashboards remain useful but require users to know report locations, filter logic, and view interactions. Non-intuitive interfaces force business users to rely on analysts for data interpretation or updates. This dependence slows decision-making and adds friction. Looker’s conversational analytics layer supports a shift toward plain-language queries. Users interact with governed data models rather than static dashboards.
See our Looker conversational analytics page for details on this interaction model.
AI changes this model. Users ask natural-language queries, such as “What happened to sales last month?” Looker provides immediate answers. Insights emerge from conversation rather than navigation. This reduces friction and extends analytics access to employees with limited BI experience. The goal is to democratize data access and support on-demand decision-making.
1. What Is Looker Analytics? Definition of AI-Driven Analytics in Looker
AI-driven analytics in Looker is a native feature, not an add-on. It adds a conversational layer to Looker’s governed data models. All AI-generated insights derive from the same trusted definitions, relationships, and metrics used by your teams.
The AI layer simplifies user interaction. Users express questions in plain language. They do not manually identify fields or dashboards.
Our complete guide for business users explains conversational analytics within Looker’s governed semantic layer.
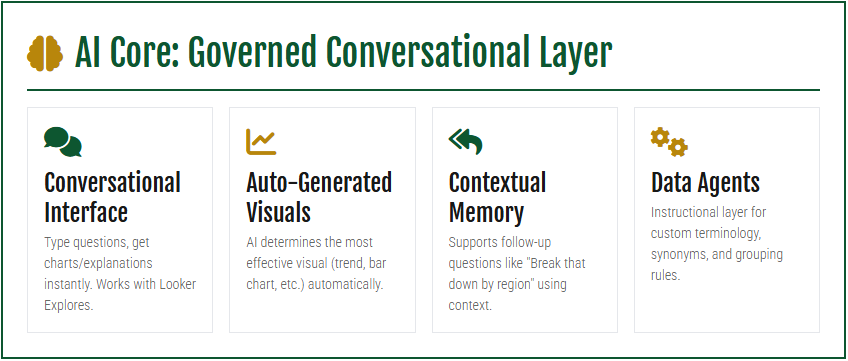
Conversational Analytics
Users type questions to receive instant charts or explanations. This removes the need to browse dashboards or explore data structures. Conversational analytics uses only Looker Explores. The semantic model governs all logic.
Auto-Generated Visuals
Looker selects the optimal visual format for each response. The system identifies the best chart type, including trend lines, bar charts, tables, or summary numbers. This automation improves comprehension for non-technical users. It eliminates manual chart selection.
Follow-Up Questions
Looker retains conversational context. When a user asks a follow-up query, the system applies the previous context to the new request. This feature creates a continuous dialogue. Users do not repeat initial criteria.
Data Agents
Data Agents define business logic for AI interpretation. Organizations configure terminology, synonyms, and default filters. These rules align AI responses with internal standards. For example, the system maps 'Location' to 'City' and sets 'Year = 2025' as a default filter. This configuration ensures consistent and predictable query results.
2. AI Applications in Business Operations with Looker
AI improves operational efficiency across industries. Integration with Looker adds control, accuracy, and alignment with enterprise data governance. This combination accelerates insight generation and maintains stable business definitions.
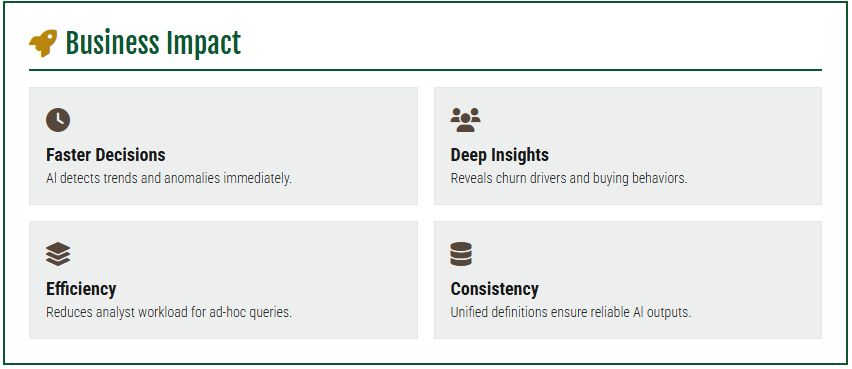
Accelerated Decision-Making
AI detects trends, anomalies, and changes in real time. Looker’s governed metrics ensure consistent insights. This reduces confusion among teams analyzing the same data.
Enhanced Customer Insights
AI identifies customer patterns, such as churn drivers, buying behaviors, and feature adoption. Looker links these insights to the unified data warehouse, ensuring they are based on clean, centralized data.
Operational Efficiency
Conversational analytics reduces analyst workload by answering most ad-hoc questions. Teams no longer wait for manual report updates.
Reduced Data Fragmentation
Looker consolidates definitions in a single semantic layer. This ensures AI outputs remain consistent across teams, departments, and regions.
Enhanced Forecasting and Planning
Looker provides historical and real-time data to AI models. This improves prediction accuracy and scenario planning.
3. Current Capabilities for Business Users
Looker’s conversational and generative features support practical use cases. They accelerate workflows and reduce dependence on analysts.
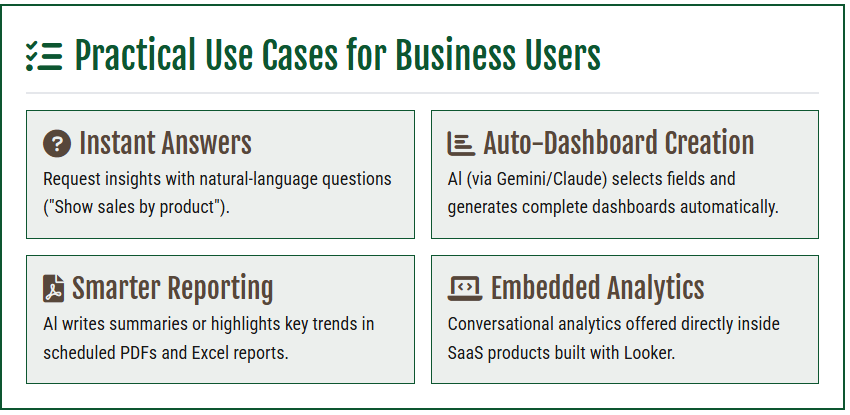
3.1 Query Data for Immediate Answers
Users request insights by entering natural-language queries. Examples include:
- “Show sales by product.”
- “Compare this year to last year.”
Looker returns a chart or explanation. Data Agents increase result accuracy and context.
3.2 Build Dashboards with AI Tools
The MCP server allows AI tools to generate dashboards automatically.
Users can issue natural language requests, such as:
“Create a revenue dashboard with top products and a trend chart.”
The AI will:
- Select the appropriate Looker model
- Select appropriate fields
- Generate dashboard tiles
- Save the complete dashboard
This removes manual dashboard creation. It reduces reliance on BI developers.
3.3 Use AI Support to Improve Reporting Quality
• Looker generates PDFs, Excel files, and scheduled reports with consistent layouts. • AI creates summaries and highlights trends. • This format improves report readability.
3.4 Embed Conversational Analytics in SaaS Applications
• Looker supports embedded conversational analytics. • Users query data within their application. • Looker enforces permissions and brand standards.
4. AI Tools for Decision-Making and Looker Integration
• Organizations use general-purpose and analytics-specific AI tools. • Looker integrates with these tools. • This integration supports scalable AI workflows.
1. General AI Assistants
- ChatGPT
- Claude
- Gemini
These models summarize and reason well. However, they do not access enterprise data without manual integration. Looker provides this access via MCP.
2. AI Tools Built for Business Intelligence
- Looker Conversational Analytics
- Tableau AI
- Power BI Copilot
These tools run inside BI platforms. They use controlled data models. Their flexibility and governance controls differ.
Key Advantages of Looker
Looker integrates AI natively for conversational BI. It also connects to external models via MCP. This structure allows AI tools to build dashboards using governed definitions. This approach ensures data accuracy and security.
5. Mechanisms for Reliable AI Output
The reliability of AI analytics depends on the data model. The Looker semantic layer (LookML) defines metrics, joins, and calculations. This layer creates a single source of truth across the organization. It prevents AI from generating conflicting logic or results.
This layer defines:
- revenue calculation logic
- table relationships
- fields for time-based analysis
- interpretation of complex or nested datasets
Looker uses governance tools such as Spectacles, Henry, and Looker Content Observer. These tools validate the model continuously. This prevents errors from reaching business users.
6. Implementation of AI-Driven Analytics in Looker
Implementation requires a robust foundation and specific configuration. Follow this sequence:
- Validate LookML Models: Verify the accuracy of metrics, joins, and aggregate logic.
- Activate Conversational Analytics: Enable the feature for designated Explores.
- Configure Data Agents: Define synonyms, rules, and domain logic.
- Validate with Real Business Questions: Test system responses across departments.
- Integrate External AI Tools: Use MCP to generate dashboards with Gemini or Claude.
- Train Users: Teach teams to phrase questions clearly.
- Maintain Governance: Use Spectacles, Henry, and Content Observer.
These steps provide a high-level overview. Successful implementation often requires deeper modeling, agent configuration, and validation. Our Looker consulting services support this process.
7. Implementation Challenges for AI-Driven Analytics in Looker
AI-driven analytics presents specific challenges. Teams must address these factors to set realistic expectations and prepare for deployment.
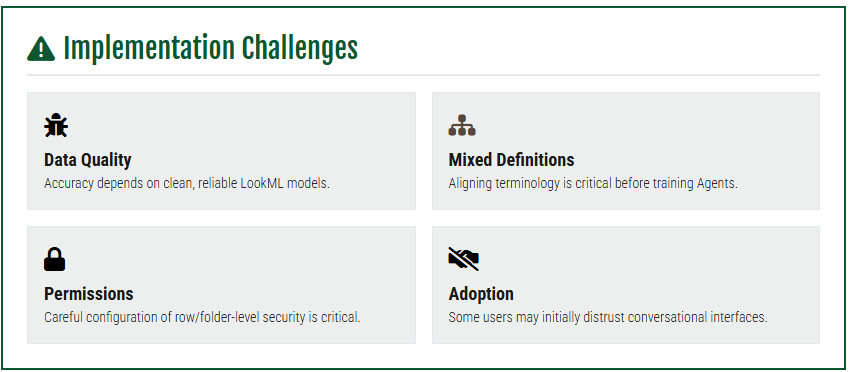
- Data Quality: AI accuracy requires reliable LookML models.
- Definition Alignment: Teams must standardize business terms before training Data Agents.
- Permissions Management: Configure row-level and folder-level security controls precisely.
- Organizational Adoption: Users require time to trust conversational interfaces.
- Integration Effort: MCP and agent orchestration require initial setup.
These challenges are manageable. They are common in enterprise transformation.
8. Conclusion: Looker Leads the AI-Driven Analytics Shift
Looker provides fast, accurate insights. Users do not need complex dashboards or BI training. The platform combines conversational AI with governed metrics. It enforces strict permissioning and consistent definitions. It integrates with external LLMs, including Gemini and Claude.
Agentspace, automated semantic modeling, and advanced conversational features link AI with governance. This balance makes Looker a reliable enterprise platform for scaled analytics.
Looker provides a stable, governed, and future-ready foundation for AI analytics. It supports modernized decision-making, faster reporting, and self-service insights.
Related reading: the guide to conversational analytics in Looker covers architecture, governance and adoption, and the natural language query post shows how business users access data faster.
Frequently Asked Questions
What is AI-driven analytics in Looker?
AI-driven analytics is a conversational layer on governed data models. Users ask natural-language questions, such as “What were last month’s sales?”, and receive instant, accurate insights.
How do business users benefit from conversational analytics?
Users answer ad-hoc questions, generate dashboards, and create reports without heavy reliance on analysts. This improves data access and speeds team decisions.
What are Data Agents in Looker?
Data Agents define business terminology, synonyms, filters, and rules. They ensure AI insights are accurate, relevant, and aligned with governance standards.
Can Looker embed conversational analytics in other applications?
Yes. Looker embeds analytics into SaaS products or internal apps. Users ask questions and receive insights within the interface while maintaining security, branding, and permissions.
What challenges arise during implementation?
Common challenges include clean LookML models, aligned definitions, permission configuration, user adoption, and external AI integration. Proper planning and governance manage these risks.
Which AI tools integrate with Looker?
Looker uses its native conversational layer. It also integrates with external tools like Gemini, Claude, or other generative AI platforms via the MCP server. This combination generates dashboards, summaries, and insights with accuracy and governance.
How does Looker ensure reliable insights?
Looker uses its LookML semantic layer, governed metrics, and tools like Spectacles and Content Observer to validate data models. This ensures consistent, accurate answers aligned with enterprise definitions, reducing errors and building trust.
Can AI in Looker build dashboards for me?
Yes, through the MCP server. AI tools can build dashboards from natural language requests, such as a revenue dashboard with top products and a trend chart. The AI selects the Looker model and fields, generates the dashboard tiles and saves the complete dashboard. This removes manual dashboard creation and reduces reliance on BI developers.
How does AI in Looker compare with Tableau AI and Power BI Copilot?
Looker Conversational Analytics, Tableau AI and Power BI Copilot are AI tools built for business intelligence. They run inside BI platforms and use controlled data models. Their flexibility and governance controls differ. Looker also connects to external models such as Gemini and Claude through MCP, so they can build dashboards from governed definitions.
Does AI-driven analytics in Looker need a clean data model?
Yes. AI accuracy requires reliable LookML models. The LookML semantic layer defines metrics, joins and calculations, which prevents AI from generating conflicting logic. Teams must also standardize business terms before training Data Agents. Tools such as Spectacles, Henry and Looker Content Observer validate the model continuously.