
Blind spots cause revenue loss. Slow insights delay corrective action. Go-to-market performance requires immediate visibility.
Financial services CMOs often struggle to lead efficient go-to-market motions. Legacy BI systems frequently limit strategic speed and clarity.
Teams launch campaigns and allocate budgets. However, optimization often fails. Delays, fragmentation, and late reports prevent timely decision-making.
This is a data architecture issue. It has a solution.
GTM Optimization Failures: Limitations of Traditional BI
Financial services organizations often use tools such as Tableau or Excel for marketing analysis. These tools lack integration with the speed of modern go-to-market operations.
Key indicators of this gap include:
- Data latency: Reports show prior-week metrics rather than current status.
- KPI silos: campaign, sales, and finance teams use different dashboards.
- Inconsistent logic: attribution, CAC, and conversion rates vary by team or analyst.
The gap is a go-to-market dashboard BI layer that keeps GTM strategy live. Paid media teams see that high-net-worth segments respond better to savings product offers than credit ads.
They need to pivot mid-week: adjust spend and re-target the segment.
Current process failures include:
- Finance records differ from marketing spend reports.
- Sales cannot confirm if leads from the new segment convert.
- BI requires additional time to reconcile data and refresh dashboards.
Insight validation delays cause teams to miss opportunity windows.
A single real-time go-to-market dashboard BI environment aligns all teams. It uses shared logic, access, and clear definitions.
Looker solves this problem.
Looker: The Foundation for Real-Time GTM Feedback
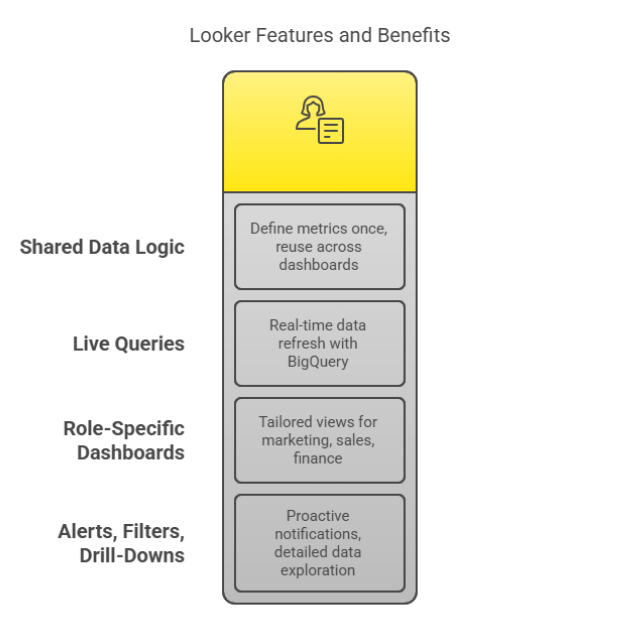
Looker provides more than a user interface. It delivers:
Shared data logic via LookML
Define metrics once (CAC, LTV, pipeline contribution). Reuse them in all dashboards for marketing, sales, and finance.
Live BigQuery queries
Data updates in real time. Eliminate weekly refreshes and manual exports.
Role-based dashboards
Create views for:
- Marketing operations (CPL, ROAS, pacing)
- Sales: conversion rates, lead quality.
- Finance: spend, cost-per-opportunity.
One data layer serves all views.
Alerts, filters, drill-downs.
CMOs receive alerts if CAC exceeds benchmarks or conversion drops in key segments. No analyst required.
This platform delivers a modern go-to-market BI experience aligned with market velocity.
Regional Bank Deploys Looker-Based GTM Dashboard
A regional bank faced weekly CAC reporting delays and BI access restrictions. These issues slowed campaign pivots. The bank migrated from Tableau to Looker and consolidated metrics in a unified LookML model. This process created a segmented GTM dashboard. Teams now align on CAC logic and reallocate spend twice weekly. They adjust campaigns within days rather than quarters.
Tableau vs Looker: Feature Comparison for GTM Execution
| Feature | Tableau | Looker |
|---|---|---|
| Data freshness | Scheduled/manual | Live via BigQuery |
| Metric governance | Defined in each workbook | Centralized in LookML |
| User roles | Viewer/editor separation | Role-based access with control |
| GTM suitability | Better for retros | Built for real-time feedback |
We assist financial services teams in migrating from Tableau to Looker. This transition accelerates GTM performance and modernizes BI infrastructure.
Contact a migration expert