
Data visualization converts raw data into actionable insights. JavaScript libraries like D3.js, Chart.js, and Plotly.js provide distinct options for customization and ease of use.
This article examines these libraries. It covers real-world use cases, company examples, and adoption trends to support project selection.
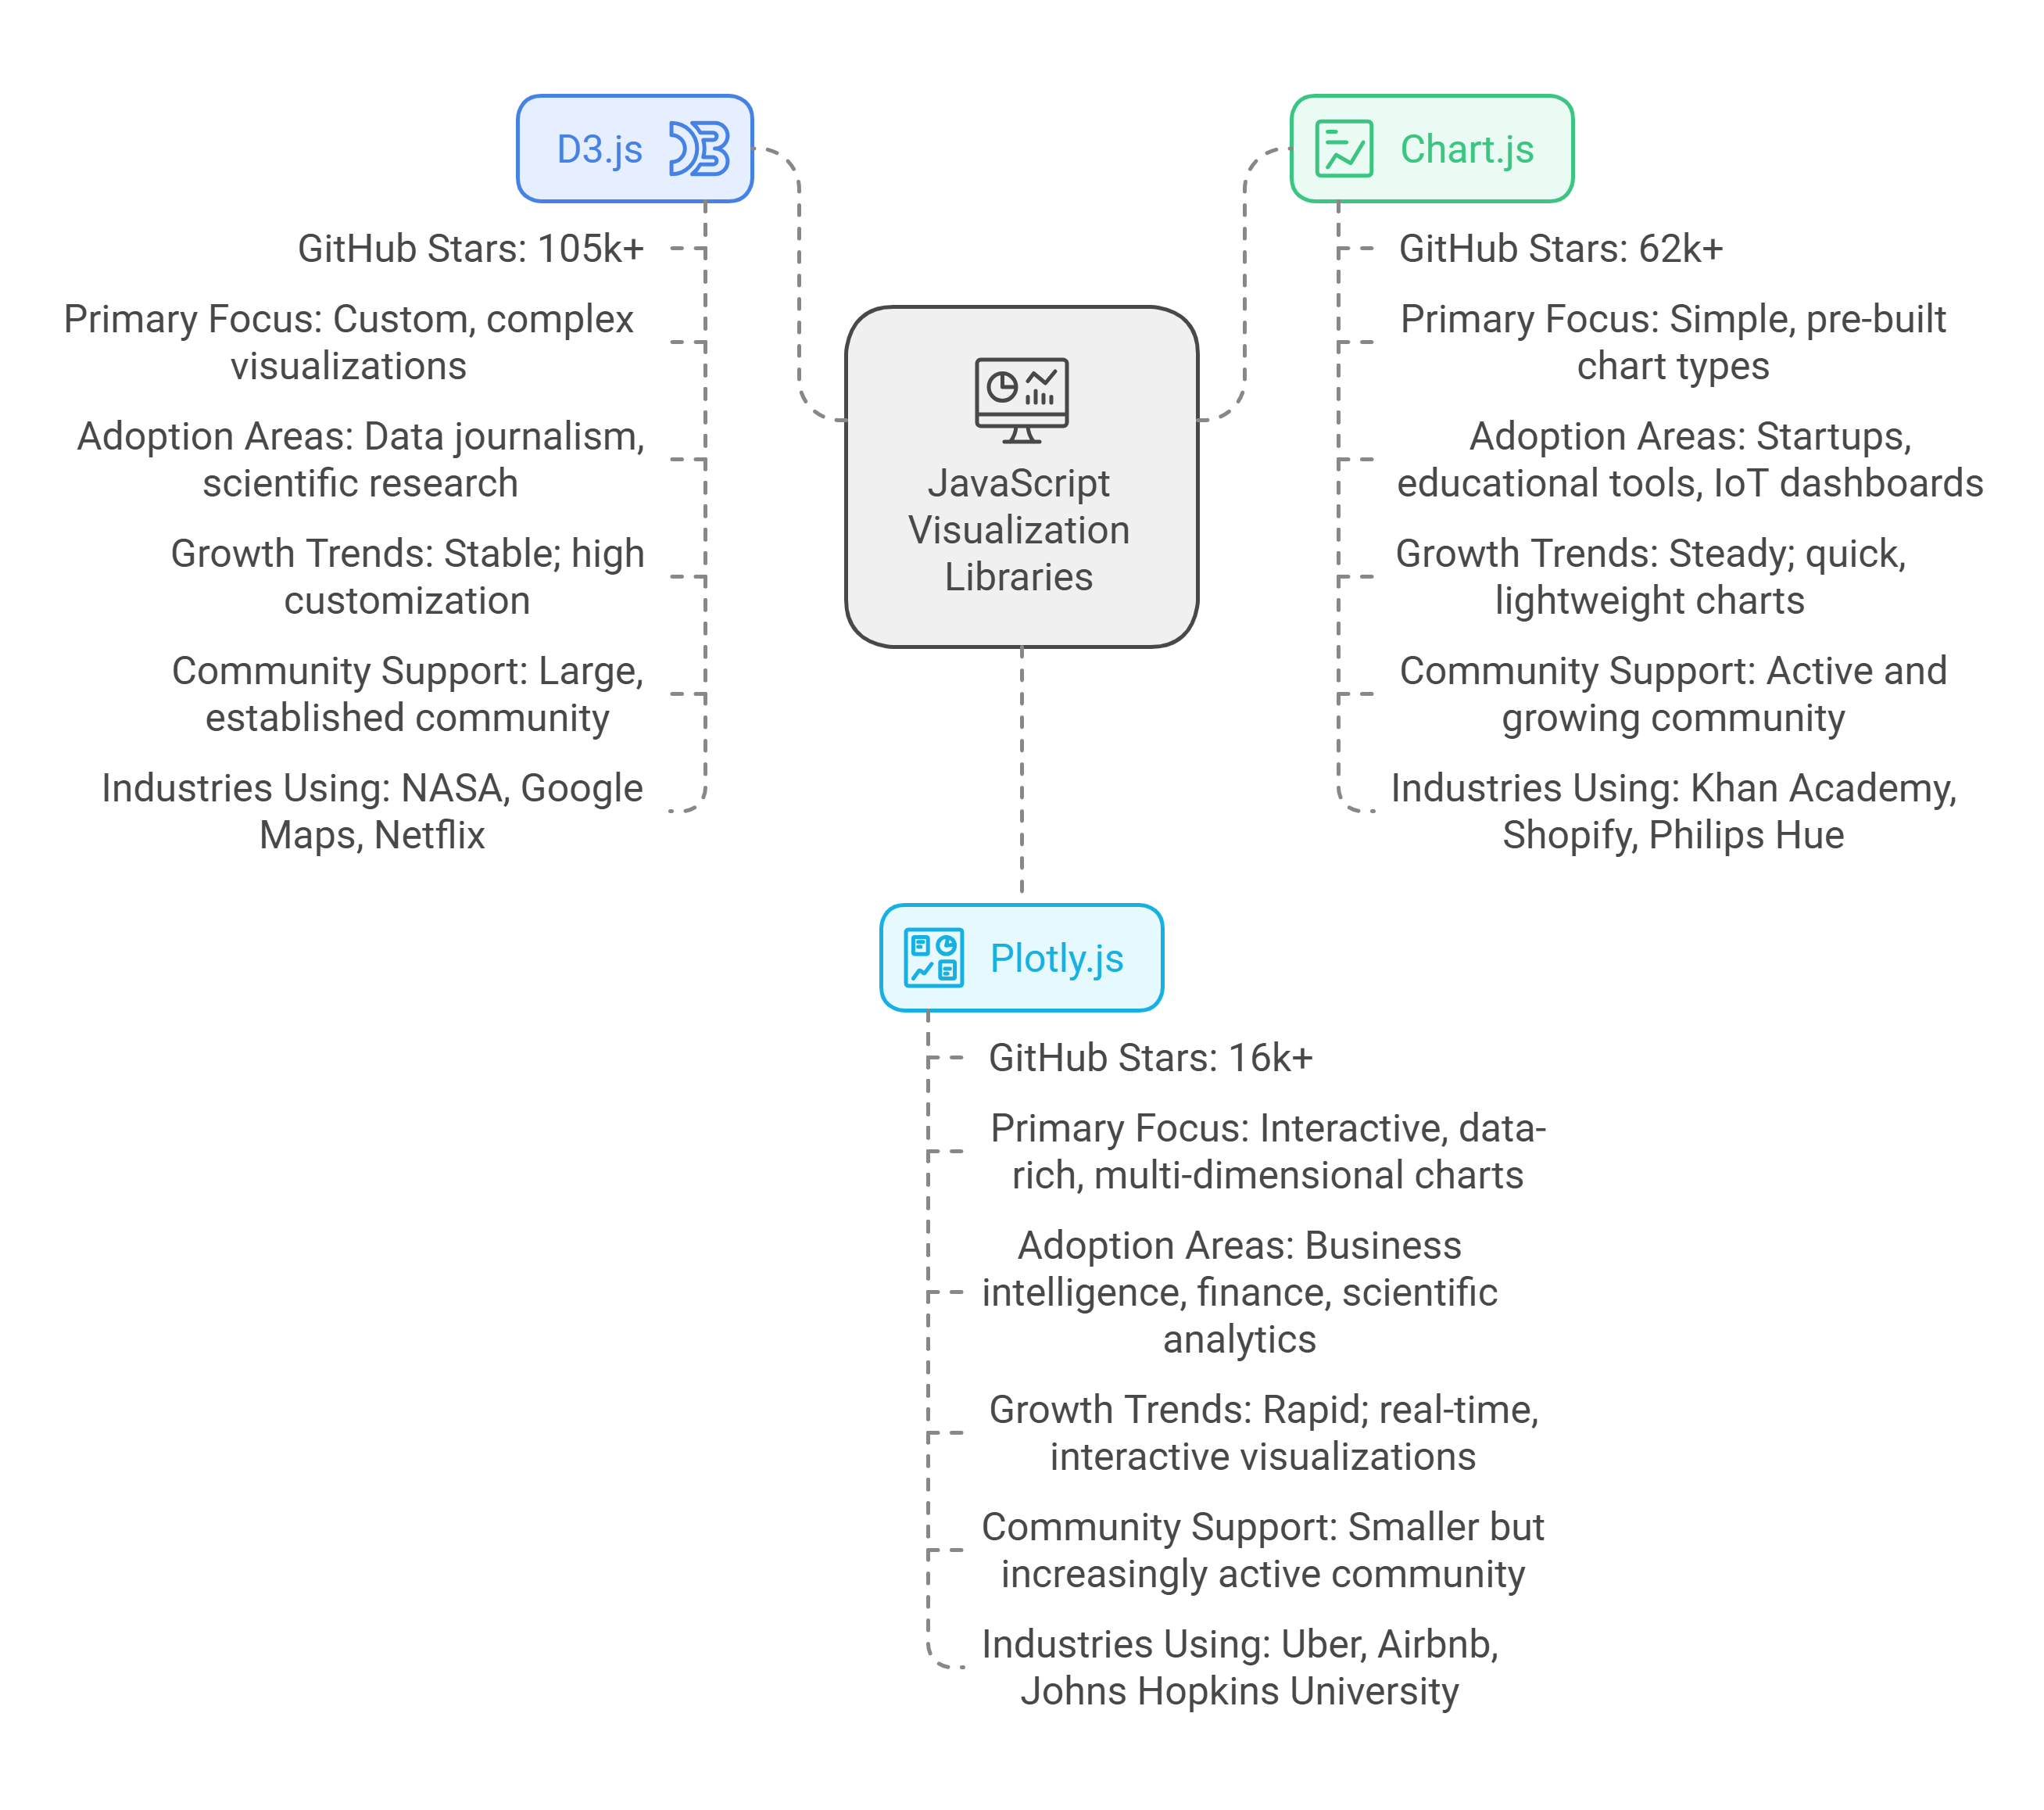
D3.js: Data-Driven Documents
D3.js provides high flexibility for custom visualizations. It manipulates data and the DOM. Developers build unique charts and complex visuals.
Use Cases
- Real-Time Data Monitoring - Twitter: Displays real-time visualizations of trending topics and hashtag performance.
- Geospatial Data Visualization - Google Maps: Plots custom geographic data overlays and interactive maps. - Uber: Maps driver locations and visualizes trip density.
- Custom Visualizations for Data-Intensive Applications - Netflix: Builds interactive dashboards to track viewer behavior and performance metrics.
- Interactive dashboards • Supports analytics-heavy domains. • Handles dynamic data representation. • Example: IBM Watson Studio uses D3.js for visual analytics tools.
Major users include:
- Uber
- Netflix
- Airbnb
- The New York Times
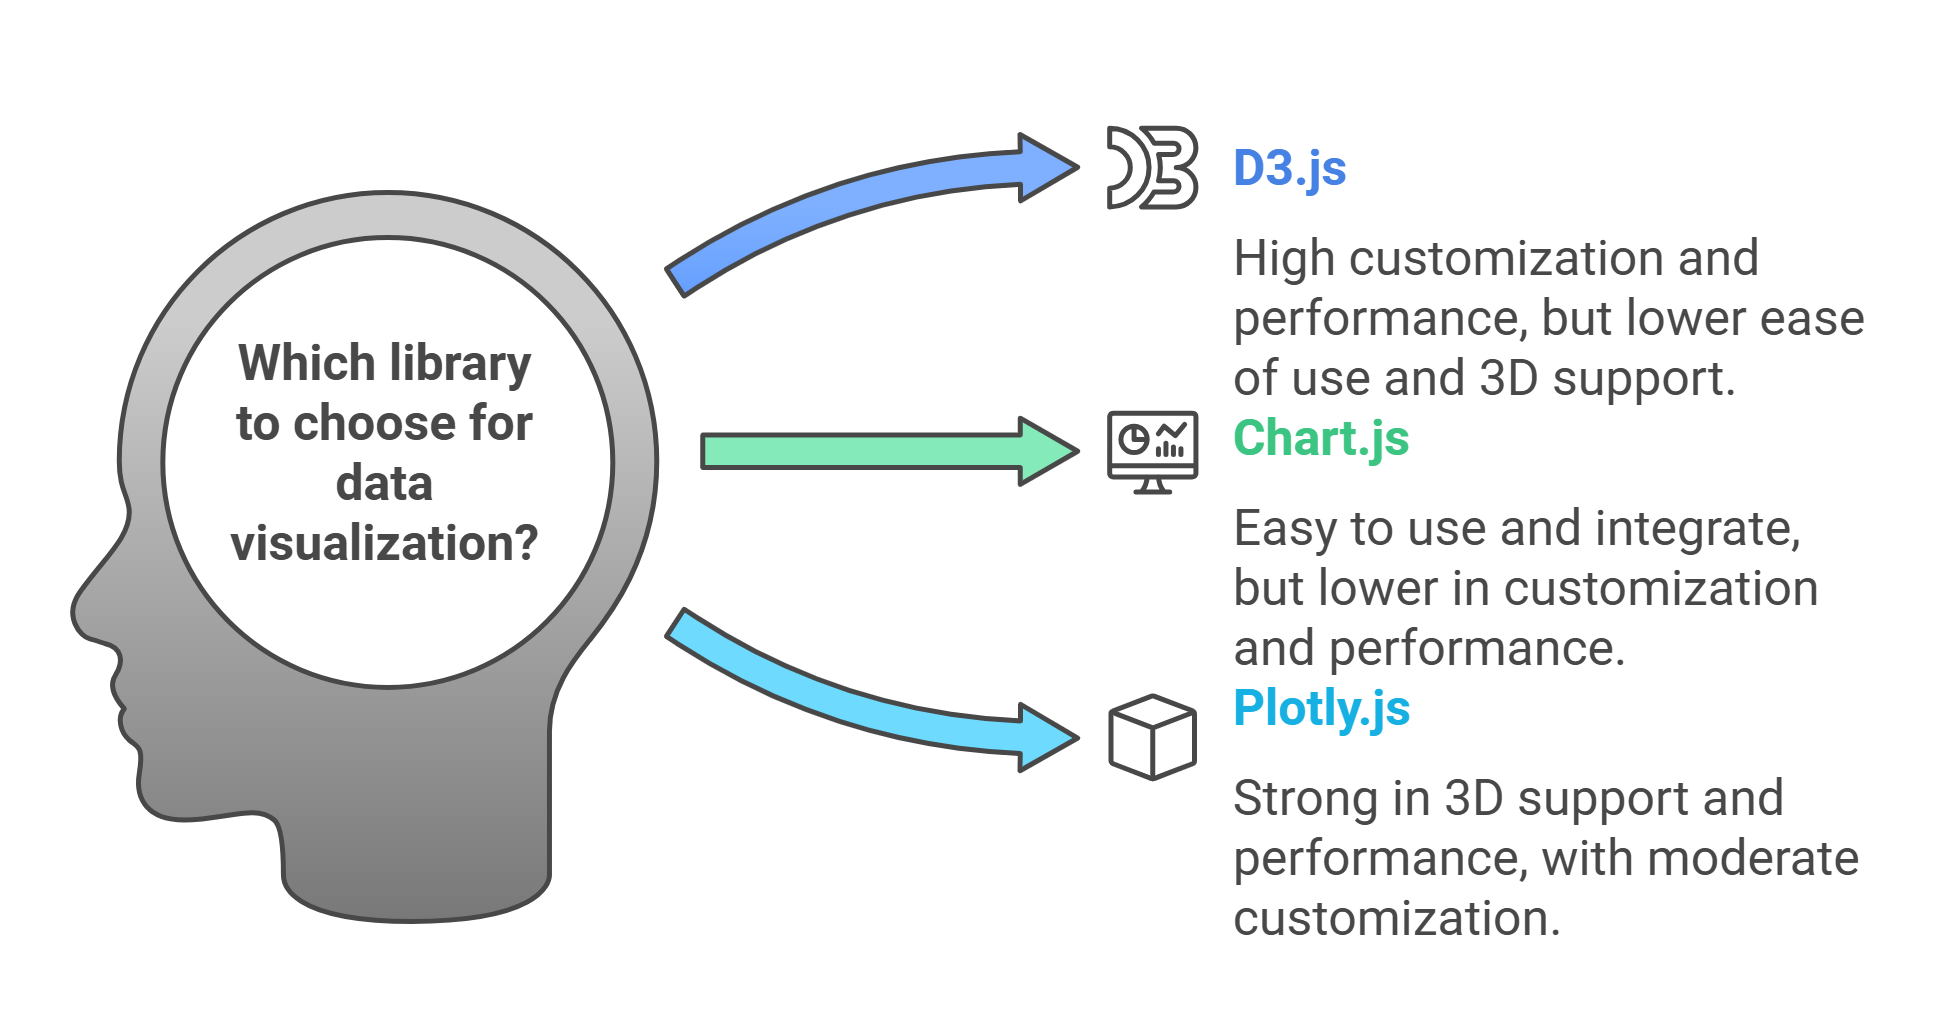
Chart.js: Standardized Visualization
Chart.js provides pre-built, responsive chart types. It supports bar, line, and pie charts. It simplifies data presentation. It suits rapid, clean visualization needs.
Application Areas
- Coinbase uses Chart.js to build real-time dashboards for tracking cryptocurrency trends.
- Strava uses Chart.js to visualize fitness data, including workout statistics and performance trends.
- Shopify uses Chart.js for analytics dashboards that track product performance and sales trends. Etsy uses Chart.js to visualize seller metrics, such as order volume and earnings.
- Nest uses Chart.js to display temperature and energy usage graphs in its smart thermostat app.
Major companies that use Chart.js include IBM, Amazon, Reddit, Slack, and Trello.
Plotly.js: Interactive Data Visualization
Plotly.js handles interactive, data-rich visualizations. It supports diverse chart types, including scatter plots, 3D charts, and heatmaps.
Use Cases
- Scientific Research and Analytics Dashboards: NASA uses Plotly.js to visualize scientific data from space exploration missions.
- Business Intelligence Tools: Uber uses Plotly.js for internal tools that analyze ride data, including heatmaps and multi-dimensional visualizations.
- Airbnb uses Plotly.js to map property distribution and track user engagement by location.
- Johns Hopkins University uses Plotly.js to display COVID-19 data trends.
Google, Tesla, NASA, Salesforce, and Pfizer use Plotly.js.

Conclusion
Choose a library based on specific needs. D3.js supports high customization. Chart.js offers a simple setup. Plotly.js enables interactive exploration. Each tool solves distinct problems. Select the option that fits the project requirements.
D3.js load times exceed Chart.js and Plotly.js. High customization increases size.
The following section covers Three.js and ECharts. These tools support 3D graphics and enterprise analytics.