
“The board asked: ‘What changed last quarter?’ And I smiled.” That response reflects control, not just confidence.
CMOs face volatile markets, complex Martech stacks, and pressure to justify spend. Gaining clarity is difficult. This article explains how a marketing leader used Looker to replace reactive reporting with proactive boardroom oversight.
Marketing Clarity Requires a Data Strategy
CMOs enter board meetings with dashboards, slides, and reports. Before Looker, preparation involved:
- Three reports from three teams
- Mismatched metrics
- Delayed responses to CAC trend inquiries
The team applied effort diligently. However, the reporting stack lacked executive clarity. Tableau and Excel supported siloed analysis but could not meet real-time, integrated decision requirements.
From Traditional BI to Real-Time Marketing Analytics
Dashboards may appear comprehensive. However, visual polish is insufficient when strategic questions arise in leadership reviews.
Key strategic questions include: Which actions drove performance changes? Which users converted via specific channels? Should investment increase, or was the result an isolated event?
These questions test the decision-making capability of leadership teams.
Decisions become difficult when data conflicts across teams or when staff wait for manual data extraction. This scenario exposes the limitations of most business intelligence tools.
We did not need additional reports.
We required fast, aligned answers.
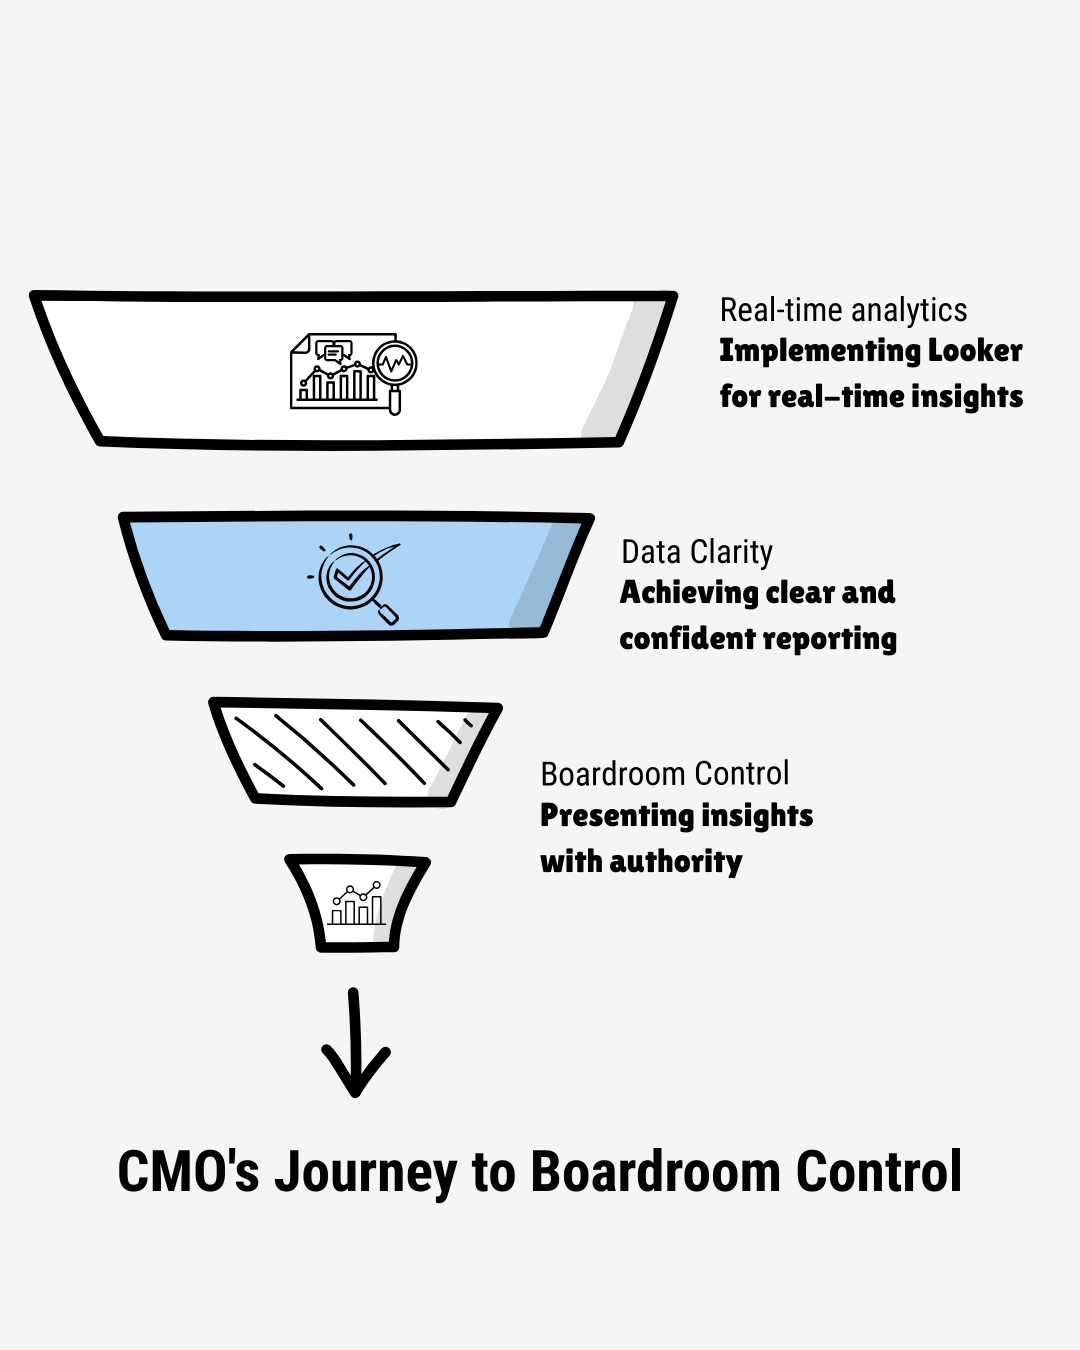
Key Changes from Looker on BigQuery
Looker provided foundational changes to data measurement, access, and trust.
1. Consistent Metrics via LookML
LookML defines core metrics (ROAS, CAC, LTV) once. Looker governance controls versions. All dashboards and users use the same logic across functions.
2. Real-Time Campaign Visibility
Looker runs queries directly on BigQuery. Performance data from search, paid social, and CRM sources is available in real time. Teams analyze performance mid-campaign. They make optimizations immediately.
3. Self-Serve Exploration for Business Users
Looker Explore allows non-technical users to filter and drill down into campaign performance. Users can segment by channel, geography, creative, or audience. No SQL or analyst support is required.
Scalable Dashboards via Persistent Derived Tables
Engineering teams used Persistent Derived Tables (PDTs) to improve performance. • PDTs are pre-aggregated tables. • Refreshes occur on a fixed schedule. • Executive dashboards display current data. • User clicks do not strain the database.
Four Operational Shifts
| Before Looker | After Looker |
|---|---|
| Metrics lived in slides and silos | Metrics defined once in LookML — reused across tools |
| Campaigns reacted to weekly reports | Campaigns adjusted mid-flight with real-time analytics |
| Dashboards looked good, but lagged | Dashboards built on live queries from BigQuery |
| “Let me follow up” was my safety net | “Here’s the breakdown by channel” became my norm |
The technical foundation enabled operational change.
Looker and Traditional BI: Operational Comparison
Dashboard design eventually reaches a limit. Data architecture becomes the constraint. The move to Looker and BigQuery is an infrastructure decision, not a tooling choice.
| Capability | Traditional BI (e.g., Tableau) | Looker + BigQuery |
|---|---|---|
| Data freshness | Extract-based, often lagging | Live queries on demand |
| Metric governance | Defined at dashboard or team level | Centralized via LookML |
| Executive drill-down | Limited interactivity | Self-service via Explore |
| Marketing agility | Retrospective performance reviews | In-flight campaign optimization |
| Scale & maintainability | Requires extract scheduling and tuning | Native scalability with cloud warehouse |
The architectural shift resolved the bottleneck. When asked about last quarter’s changes, the response was immediate.
No delay. No friction. Immediate access.
The data provided the numbers and the context behind them.
Require This Clarity
• Inconsistent dashboards slow execution. Delayed reporting obscures performance. Fragmented data breaks alignment. We resolve these issues for CMOs.
• Proper Looker implementation improves reporting speed. It provides data control. It supports confident decision-making.
Contact our migration expert