

You prepare for the quarterly marketing review.
The CMO asks, "Which channel generated the most pipeline in Q1?"
You open the Tableau dashboards.
Then an Excel file from the email team.
Then a Salesforce report.
Then a CRM export.
Then you request paid ads data for verification.
Five sources. Five different values.
The data remains unclear.
If chasing reports delays basic marketing decisions, accept the root cause:
Marketing performance reporting exceeds current tool capabilities.
Why Marketing Performance Reporting Fails
Initially, the technology stack was simple:
- One CRM.
- One campaign tool.
- One dashboard.
As marketing expanded across channels, regions, and customer segments, data gaps emerged:
- Siloed data: Email, paid ads, webinars, and product usage tracked in separate systems.
- Manual Integration: Analysts merge spreadsheets manually, assuming field names align.
- Version Drift: Teams create separate datasets based on local dashboards.
- Delayed Insights: Comprehensive reports contain outdated data upon completion.
Slow, fragmented reporting limits growth in fast-moving markets.
Clear visibility enables effective correction.
Question: Does an existing Tableau environment meet all data needs?
Tableau visualizes defined data sets.
High marketing complexity exposes system limits:
- Static Extracts: Tableau uses scheduled data extracts. It does not support real-time data.
- Limited Semantic Layer: Business logic resides in individual reports. Central governance is limited.
- Manual Data Stitching: Teams must manually join data across sources. Analysts maintain these connections.
- Fragmented Analysis: Different teams build separate dashboards. They use conflicting metric definitions.
Marketing performance reporting becomes a fragile patchwork.
Looker targets legacy environments.
Establish a Single Source of Marketing Truth with Looker
Looker uses a distinct method for marketing performance reporting.
Looker unifies the underlying marketing data architecture. It replaces fragmented dashboards.
Looker solves the "five reports, one question" problem in three ways:
1. Governed Semantic Layer (LookML)
The Looker semantic layer lets data teams define metrics once. It uses LookML code. It avoids hidden formulas.
Standardize metrics like MQL Conversion Rate, CAC, and Pipeline Velocity for reuse.
Impact:
- All dashboards, Explores, and users use the same definitions.
- Update definitions centrally once. Remove changes from 50 dashboards.
2. Run Live Queries in Real Time
Looker queries your cloud data warehouse, such as BigQuery, in real time.
Eliminates stale extracts and outdated joins.
View live campaign performance and paid ad spend with governed data.
Result:
- Marketing leaders make decisions with confidence.
- Analysts resolve data disputes quickly.
3. Controlled Self-Service Exploration
Looker allows marketing managers, demand generation teams, and regional leads to analyze data directly within a governed environment.
Users filter by channel, campaign, region, or buyer segment without exporting data to Excel.
Built-in governance prevents accidental metric errors.
Impact:
- Faster insights.
- Empowered teams.
- Reduced analyst load.
4. Unified Views Across Channels
Looker combines campaign data, web analytics, CRM events, product usage, and finance data into a single marketing view.
Eliminate contradictory channel metrics. View the full customer journey clearly.
Impact:
- Accurate multi-touch attribution.
- Optimized budget allocation.
- Improve go-to-market performance.
Results: Stopping the search for reports
A major fintech client had this issue.
Pre-implementation state:
- Four or more tools were required to answer basic funnel questions.
- Team members use Tableau for some channels and custom SQL for others.
- Reports run on a monthly schedule. This limits agility.
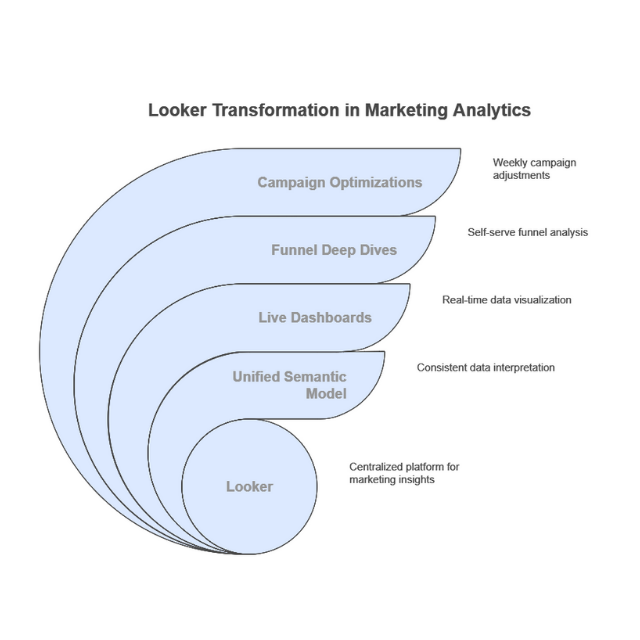
After the team adopted Looker:
- One semantic model defines all marketing KPIs.
- Dashboards show live data from BigQuery.
- Users analyzed funnel drop-offs and velocity independently.
- Teams optimized campaigns weekly instead of quarterly.
Lead-to-opportunity conversion increased by 16%. Pipeline velocity increased by 12%.
Key lesson:
- Better visualization alone is insufficient.
- Single source of truth enables faster decision-making.
Stop reconciling conflicting data across multiple dashboards.
SquareShift migrates your data to a unified platform.
Consult SquareShift migration experts.
To go further, read how Looker brings scalable governance to marketing teams, an introduction to Looker and BigQuery for marketing analytics, and why CMOs in financial services need a unified BI stack.
Contact an expert