
Gantt charts are a fundamental tool in project management. They provide a visual timeline for tracking tasks, deadlines, and dependencies. Effective use increases productivity, improves communication, and keeps projects on schedule.
Use Gantt charts in project management to:
- Improve task visibility and planning by 40-50%.
- Improve team collaboration by 30-40%.
- Decrease scheduling conflicts by 20-30%.
- Increase on-time delivery rates by 35-45%.
This article covers Gantt chart fundamentals, benefits, and usage tips.
Definition of a Gantt Chart
A Gantt chart displays a project schedule. It shows:
- Tasks: Required activities.
- Timeline: Start and end dates for each task.
- Dependencies: Relationships that define task order.
- Progress Tracking: Current task status.
Example: A software project may use a Gantt chart to track requirements, coding, testing, and deployment.
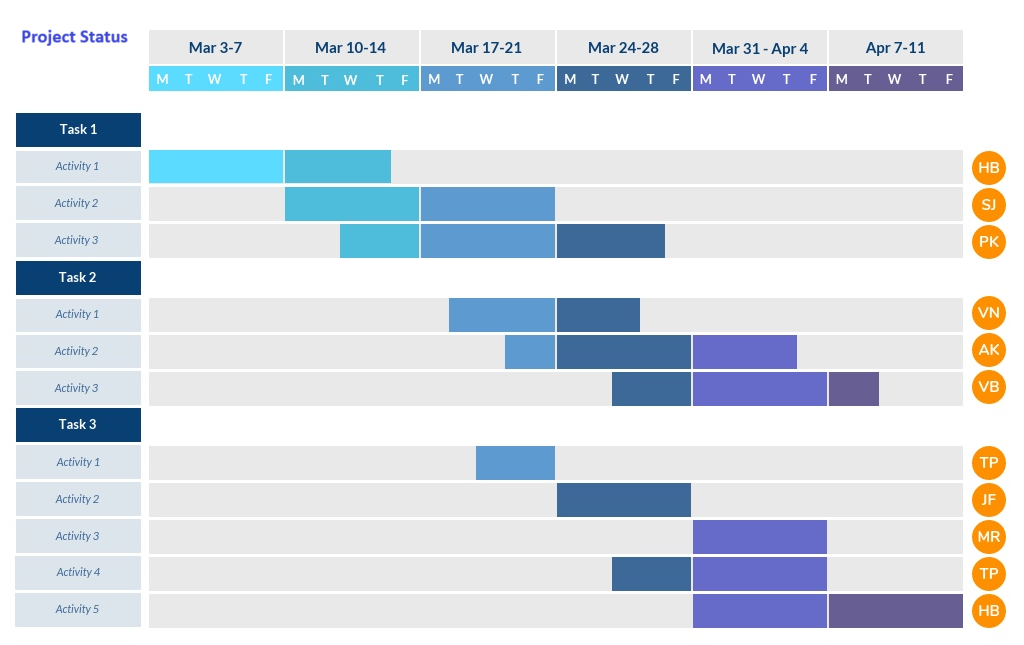
Effective Gantt Chart Creation and Application
1. Define Project Scope and Tasks
Break the project into discrete tasks. Assign start dates, end dates, owners, and resources.
Example: A product launch includes market research, branding, prototyping, and final release.
Define Dependencies
Link tasks with dependencies to establish correct sequence.
Example: Testing starts after development ends.
Set Realistic Deadlines
Assign achievable timelines to prevent stress. Use historical data or team input for accurate estimates.
4. Select Appropriate Software
Microsoft Project, Smartsheet, and Trello provide complete Gantt chart capabilities.
Key features include drag-and-drop editing, automatic date updates, and team collaboration functions.
5. Track Progress
Update the Gantt chart regularly to show current status. Resolve delays immediately.
Example: Weekly reviews update the chart and align teams.
Key Benefits of Gantt Charts
| Benefit | Impact |
|---|---|
| Improved Task Visibility | Increases clarity and planning by 40-50% . |
| Enhanced Resource Utilization | Optimizes resource allocation by 20-30% . |
| Reduced Project Delays | Improves on-time delivery by 35-45% . |
| Boosted Team Collaboration | Strengthens teamwork by 30-40% . |
Conclusion: Gantt Charts and Project Success
Gantt charts provide a clear project roadmap.
Gantt charts improve task visibility, reduce delays, and optimize resource utilization by 50%.