
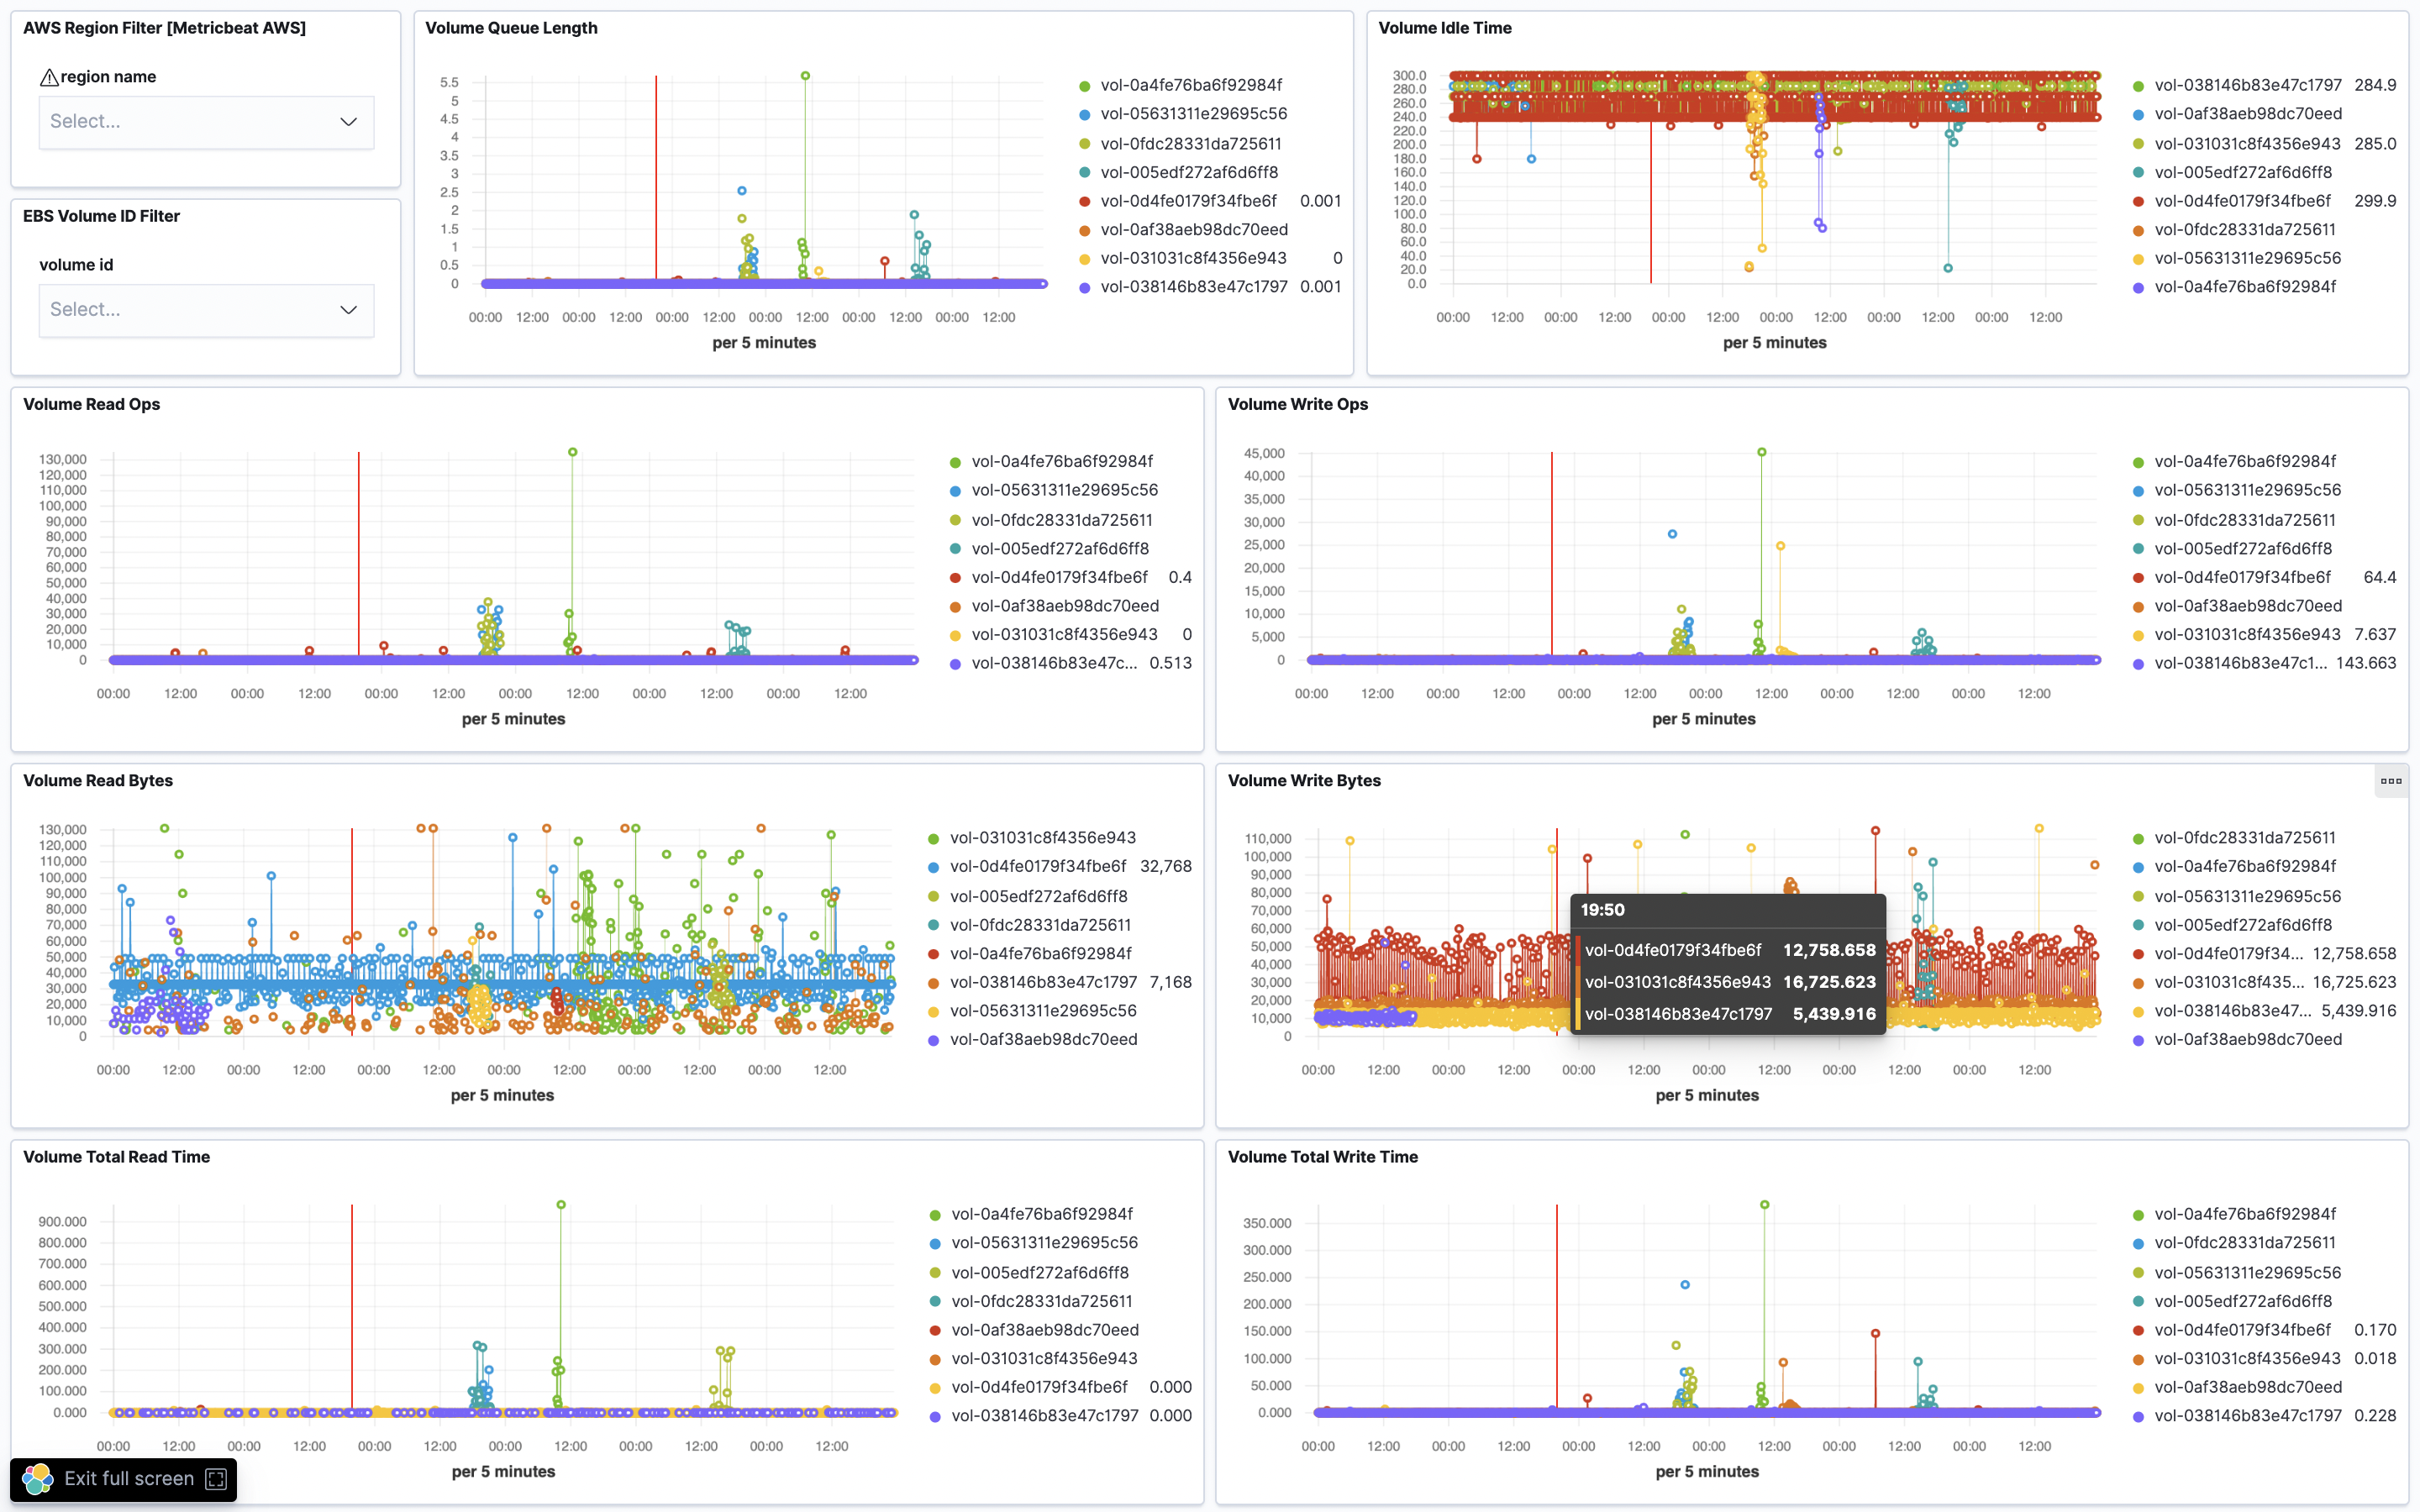
Cloud platforms provide increasing numbers of native services. These platforms include built-in monitoring. However, these tools lack a consolidated view. This limits administrative utility. Third-party providers such as Elastic, Datadog, and Splunk solve this issue. They provide a common platform. They aggregate service logs and provide visualization.
This article demonstrates the use of Elastic. In short: Metricbeat and Filebeat, with their AWS modules, send AWS managed service metrics and logs to Elasticsearch, and Kibana shows them in dashboards.
For help with Elastic monitoring on AWS, see our Elastic monitoring services.
Elastic provides default dashboards. These dashboards visualize AWS managed services. The services include Load Balancers, VPC, S3, CloudTrail, and Billing. This section uses a sample web application on AWS. It shows how to view consolidated dashboards in Kibana.
Monitoring Dashboards for AWS Managed Services
This exercise creates dashboards for the infrastructure monitoring team. These dashboards show service status. The team uses them to find and fix problems.
- EBS Metrics
- AWS CloudTrail Metrics
- AWS VPC Flow Logs
- AWS Elastic Load Balancer
- AWS Billing Dashboard
- AWS S3 Dashboard
- AWS Usage Dashboard
- AWS SQS Dashboard
- AWS Lambda Metrics
- AWS EC2 Dashboard
Deployment Architecture
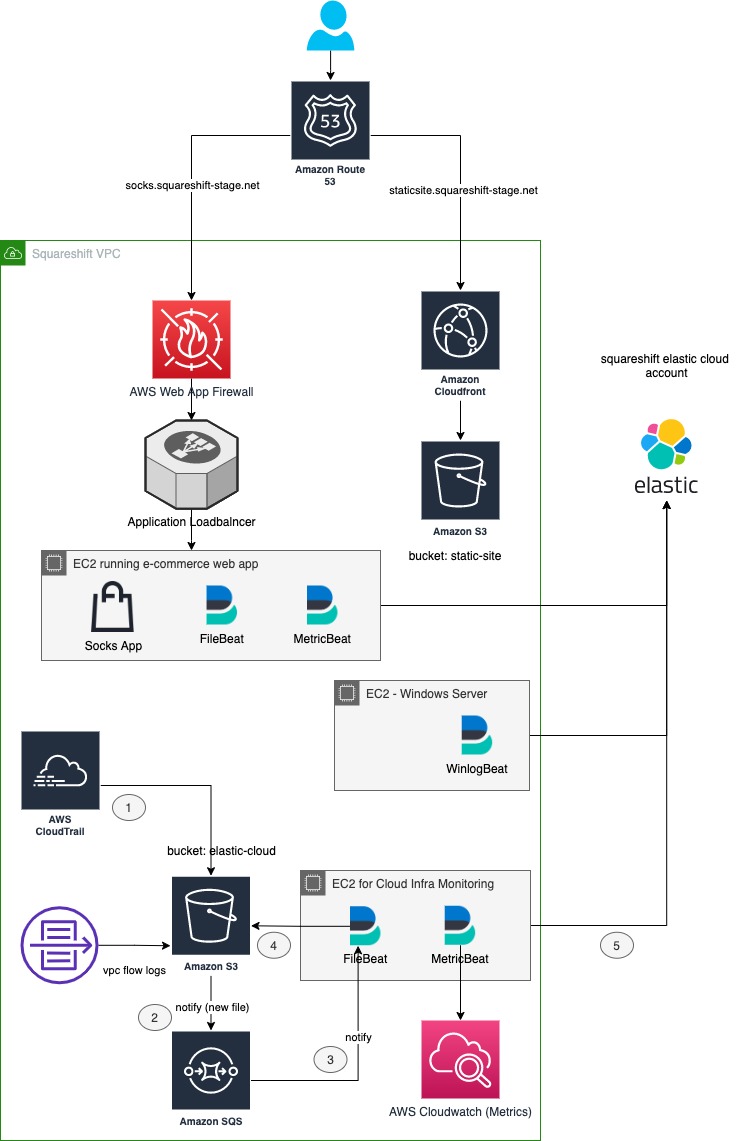
The following figure shows a standard web application deployed on AWS. This architecture uses a combination of cloud-native services and a web application server to serve APIs. The system also hosts a static site on CloudFront to serve static HTML and CSS content.
Metricbeat: Collect AWS CloudWatch Metrics for Elastic
Metricbeat is a lightweight shipper. You can install Metricbeat on your servers to collect metrics from the operating system and running services. Metricbeat collects CPU usage, disk I/O, and network bytes in and out. Metricbeat sends these metrics to a specified output, such as Elasticsearch or Logstash. Metricbeat supports pre-built modules. This article focuses on the AWS module.
Metricbeat collects two metric categories: host metrics and managed services metrics. Use one EC2 instance to run Metricbeat for AWS managed services metrics. Use a second EC2 instance to run Metricbeat for host server metrics.
Note: This article covers Metricbeat agent version 7.4 and later.
AWS Module
The Metricbeat AWS module supports default collection for the following AWS services:
- EC2
- Elastic Load Balancer
- Lambda functions
- NAT Gateway
- RDS
- S3 Storage
- SNS
- SQS
- Transit Gateway
- VPN
- Cost
Review the metric collection, storage, and transmission architecture before configuring Metricbeat.
- Enable CloudWatch metrics for each AWS managed service. This action initiates data flow from AWS services to CloudWatch. Metricbeat reads this data. See AWS documentation for service-specific instructions.
- Run Metricbeat on Amazon EC2 instances. Configure the instance to collect AWS managed service metrics. Enable the AWS module in the Metricbeat configuration file.
- Metricbeat queries AWS CloudWatch at regular intervals. It sends metrics to Elasticsearch. Elasticsearch indexes the data. Kibana visualizes the data.
Prerequisites
Run Metricbeat with these requirements:
- AWS account with credentials. The Roles section lists the permissions Metricbeat needs to read metrics.
- Elastic Stack. Use a self-hosted cluster or a free 14-day Elastic Cloud trial. This article does not support AWS Managed Elasticsearch.
- EC2 instance to host the Metricbeat agent
IAM Policy
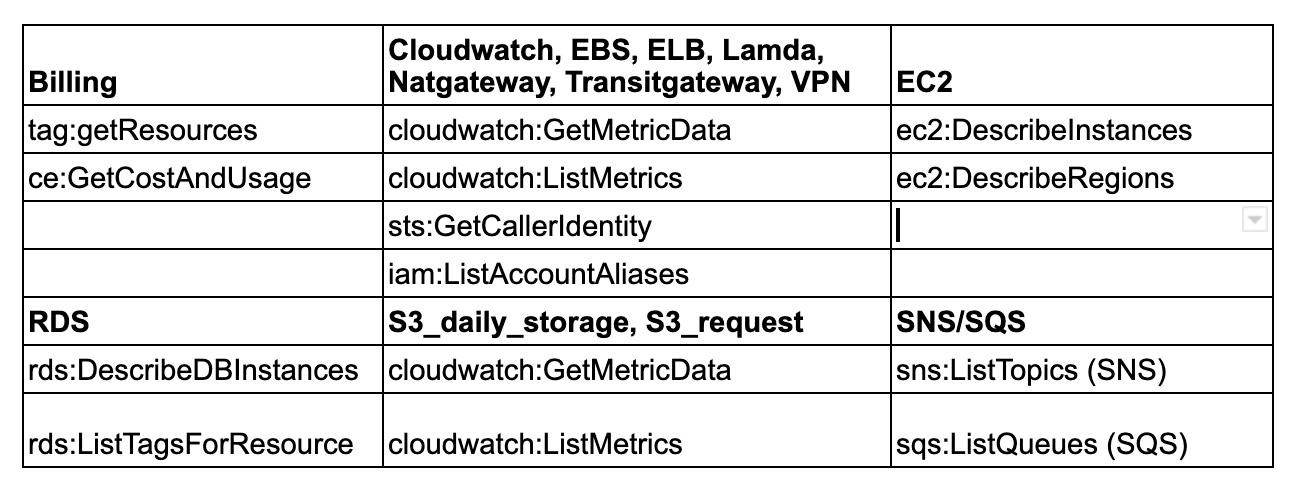
Metricbeat requires specific IAM permissions to read data from AWS resources. An IAM policy defines these permissions. Create a custom IAM policy for Metricbeat. See "Creating IAM Policies" for details. Attach this policy to the IAM user identified in the previous step.
Table 1 lists the required IAM policies for each Metricbeat instance.
Consolidated IAM Policy
{
    "Version": "2012-10-17",
    "Statement": [
        {
            "Effect": "Allow",
            "Action": [
                "ec2:DescribeRegions",
                "ec2:DescribeInstances"
            ],
            "Resource": [
                "*"
            ]
        },
        {
            "Effect": "Allow",
            "Action": [
                "cloudwatch:GetMetricData",
                "cloudwatch:ListMetrics"
            ],
            "Resource": [
                "*"
            ]
        },
        {
            "Effect": "Allow",
            "Action": [
                "sts:GetCallerIdentity"
            ],
            "Resource": [
                "*"
            ]
        },
        {
            "Effect": "Allow",
            "Action": [
                "iam:ListAccountAliases"
            ],
            "Resource": [
                "*"
            ]
        },
        {
            "Effect": "Allow",
            "Action": [
                "tag:getResources"
            ],
            "Resource": [
                "*"
            ]
        },
        {
            "Effect": "Allow",
            "Action": [
                "rds:DescribeDBInstances",
                "rds:ListTagsForResource"
            ],
            "Resource": [
                "*"
            ]
        },
        {
            "Effect": "Allow",
            "Action": [
                "sns:ListTopics"
            ],
            "Resource": [
                "*"
            ]
        },
        {
            "Effect": "Allow",
            "Action": [
                "sqs:ListQueues"
            ],
            "Resource": [
                "*"
            ]
        },
        {
            "Effect": "Allow",
            "Action": [
                "ce:GetCostAndUsage"
            ],
            "Resource": [
                "*"
            ]
        }
    ]
}
Metricbeat Agent
Install the Metricbeat agent on an EC2 instance
Start an Ubuntu EC2 instance. Connect to the instance. Run the commands below to download and install Metricbeat.
curl -L -O https://artifacts.elastic.co/downloads/beats/metricbeat/metricbeat-7.11.1-amd64.deb
sudo dpkg -i metricbeat-7.11.1-amd64.deb
Edit the configuration
Elastic Cloud
Edit /etc/metricbeat/metricbeat.yml. Set the Elastic Cloud connection settings.
cloud.id: <Get your cloud_id from the Elastic Cloud>
cloud.auth: "elastic:<password>"
Enable the AWS module
Metricbeat enables only the system module by default. Enable the AWS module explicitly. Run the following command on macOS or Linux systems to enable the AWS configuration in the modules.d directory:
metricbeat modules enable awsSet AWS credentials in the config file
Store AWS credentials in the Metricbeat module configuration or pass them via environment variables. The AWS module supports loading credentials from a shared credentials file. Create a shared credential file at the following location using these steps.
For Windows:
C:\Users\<yourusername>\.aws\credentials

For  Linux, MacOS, or Unix:
~/.aws/credentials
(Optional) Specify the profile name using the credential_profile_name parameter in the AWS module configuration. See AWS credentials configuration for supported credential types and formats.
AWS Module Configuration Example
metricbeat.modules:
- module: aws
  period: 300s
  metricsets:
    - ec2
- module: aws
  period: 300s
  metricsets:
    - sqs
  regions:
    - us-west-1
- module: aws
  period: 86400s
  metricsets:
    - s3_request
    - s3_daily_storage
- module: aws
  period: 300s
  metricsets:
    - cloudwatch
  metrics:
    - namespace: AWS/EC2
      name: ["CPUUtilization"]
      statistic: ["Average"]
    - namespace: AWS/EBS
    - namespace: AWS/ELB
      resource_type: elasticloadbalancing
- module: aws
  period: 60s
  metricsets:
    - elb
    - natgateway
    - rds
    - transitgateway
    - usage
- vpn- namespace: An AWS CloudWatch namespace is a container for metrics from a specific application or service. Each service has a unique namespace. For example, Amazon EC2 uses the AWS/EC2 namespace, and Amazon Elastic Block Storage uses the AWS/EBS namespace. See the full list of services and namespaces that publish CloudWatch metrics for details.
- name: Users specify the CloudWatch metrics to collect for each namespace.
- dimensions: Dimensions refine the metrics returned for each instance. For example, users can filter Amazon EC2 data using InstanceId, ImageId, or InstanceType.
- statistic: Users specify one or more statistic methods for each CloudWatch metric. The system collects average, count, maximum, minimum, and sum by default for each metric.
- resource_type_filter: Set this parameter to collect tags. Omitting it prevents tag collection. AWS resources use the format service[:resourceType]. See resource type filters for valid values.
- credential_profile_name: If AWS credential configuration exists, the tool detects it automatically. Otherwise, enter the details manually.
Start Metricbeat
The setup command installs Kibana dashboards. If dashboards already exist, do not run this command.
sudo metricbeat setup
sudo service metricbeat start
Module Status
Metricbeat includes pre-built Kibana dashboards for log visualization. The setup command installed these assets.
In the Kibana side navigation:
- Select Discover to view Metricbeat data. Ensure the metricbeat-* index pattern is active.
- Select Dashboard. Search for "AWS metric*". Select the target dashboard.
Filebeat: Ship AWS Service Logs to Elastic
Filebeat is a lightweight log shipping agent. You install it on your servers. It monitors specified log locations. It collects events. It sends data to Elasticsearch or Logstash for indexing. Filebeat includes pre-built modules. This article covers the AWS module.
AWS Module Support
The Filebeat AWS module supports the following services:
- CloudTrail
- CloudWatch
- Amazon EC2
- Elastic Load Balancing
- S3 Access Logging
- VPC Flow Logs
Prerequisites
Requirements for Filebeat operation:
- Configure AWS services to log to S3: - CloudTrail to S3 - VPC Flow Logs to S3 - ELB Access Logs to S3 - Enable S3 Server Access Logs
- Create an Amazon SQS queue. Filebeat uses this queue to detect new objects in the S3 bucket from the previous step.
- AWS account with valid credentials.
- Elastic Stack deployment. Use an Elasticsearch Service cluster on Elastic Cloud or a self-managed cluster.
- Filebeat agent
Filebeat agent:
Install the Filebeat agent
curl -L -O https://artifacts.elastic.co/downloads/beats/filebeat/filebeat-7.11.1-amd64.deb
sudo dpkg -i filebeat-7.11.1-amd64.deb
Configure
1. Edit /etc/filebeat/filebeat.yml. Set the Elastic Cloud connection details.
cloud.id: <Get your cloud_id from the Elastic Cloud>
cloud.auth: "elastic:<password>"
2. Configure S3 to send notifications to SQS for new objects.
See the linked documentation for steps to enable S3 event notifications to SQS.
Enable the AWS module
Enable the AWS module in the Filebeat configuration. The command below enables the AWS configuration in the modules.d directory on MacOS and Linux systems:
sudo filebeat modules enable awsConfigure AWS credentials in the config file
Skip if configured during Metricbeat setup.
Configure AWS credentials via the Filebeat module configuration or environment variables. Create a shared credential file at the following location:
For Windows:
C:\Users\<yourusername>\.aws\credentials

For  Linux, MacOS, or Unix:
~/.aws/credentials
Optional: Specify the profile name using the credential_profile_name parameter in the AWS module configuration. See AWS credentials configuration for supported formats.
Example AWS configuration for Filebeat:
- module: aws
  cloudtrail:
    enabled: true
    var.queue_url: https://sqs.myregion.amazonaws.com/123456/myqueue
  cloudwatch:
    enabled: true
    var.queue_url: https://sqs.myregion.amazonaws.com/123456/myqueue
  ec2:
    enabled: true
    var.queue_url: https://sqs.myregion.amazonaws.com/123456/myqueue
  elb:
    enabled: true
    var.queue_url: https://sqs.myregion.amazonaws.com/123456/myqueue
  s3access:
    enabled: true
    var.queue_url: https://sqs.myregion.amazonaws.com/123456/myqueue
  vpcflow:
    enabled: true
var.queue_url: https://sqs.myregion.amazonaws.com/123456/myqueue- var.queue_url: (Required) The URL of the AWS SQS queue.
Start Filebeat
The setup command loads Kibana dashboards. If dashboards exist, omit this command.
sudo filebeat setup
sudo service filebeat start
Module status
Filebeat includes pre-built Kibana dashboards and user interfaces for log visualization. These dashboards load during the setup command.
In Kibana side navigation:
- Select Discover to view Filebeat data. Verify that the predefined filebeat-* index pattern is selected.
- Select Dashboards. Search for "AWS Filebeat*". Select the target dashboard.
Related reading: what Elastic Observability covers and Elastic vs Splunk for observability.