
Introduction
Elasticsearch supports managed cloud services on AWS, Azure, and GCP. This article benchmarks performance across these providers. We use EsRally, a standard tool for Elasticsearch performance testing.
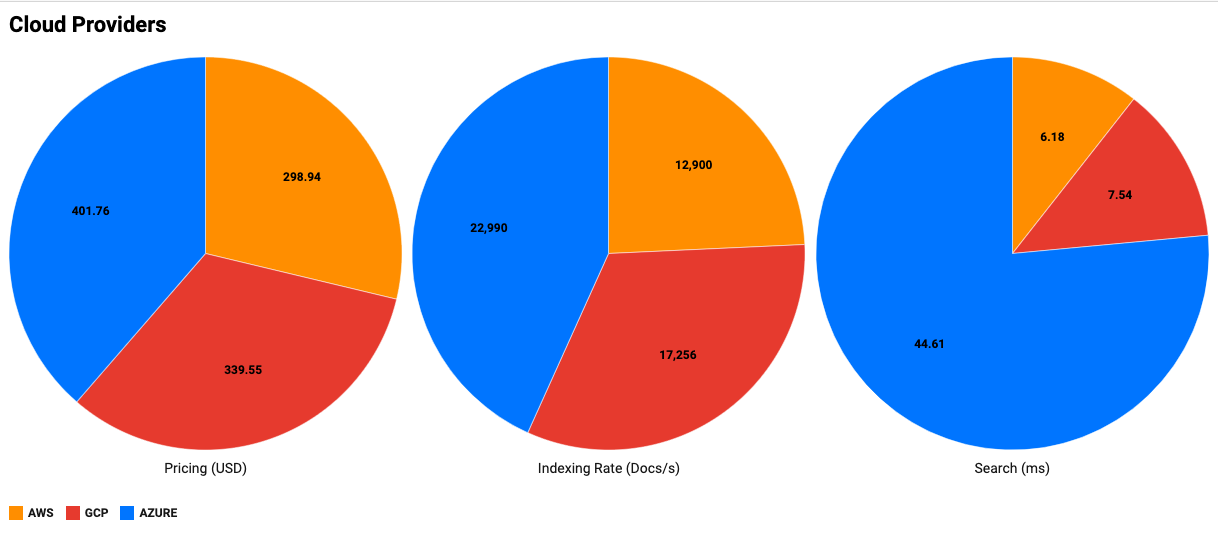
In this benchmark, Azure search service times were 6 to 7 times higher than AWS and GCP, and AWS pricing was lower than GCP and Azure for equivalent workloads.
Computing Resources
Elasticsearch cluster performance depends on allocated computing resources. Memory, storage, compute, and network form the primary resource profile. This study uses a uniform 3-node cluster configuration across all supported cloud providers.
Note: Microsoft Azure does not support ARM processors.
Amazon Web Services (AWS)
Architecture
The table below lists the configuration for the Elasticsearch cluster deployed on AWS.
See the link for the hardware profile.
Google Cloud Platform
Architecture
The table lists the configurations for the Elasticsearch cluster on GCP.
See the link for the hardware profile.
Microsoft Azure
Architecture
The following table lists the configurations for the Elasticsearch cluster on Azure.
See the following link for hardware profile details.
Benchmarking Elastic Cloud with EsRally
Create virtual machine (VM) instances in the target regions for each cloud provider. Place the VM in the same zone as the Elasticsearch cluster to reduce network latency. For example, deploy the cluster and VM in AWS US-East. Repeat this setup in GCP and Azure. Run ES Rally from these local VMs to ensure consistent test results.
ES Rally is an Elasticsearch benchmarking framework. It performs end-to-end performance analysis of an Elasticsearch cluster.
Split the benchmark into two sections: Indexing and Search Requests. Use the existing metricbeat and geonames tracks. Apply the following configuration:
- Set the default bulk size to 5,000.
- Set the client count to 8.
- Primary Shards: 1
- Replica Shards: 1
Benchmarks ran multiple times. Results below show the average of all successful runs.
Indexing Benchmark
Metricbeat Index
This benchmark uses Metricbeat data with the following specifications:
- Total documents: 1.1 million
- Data volume: 1.1 GB
Capture total response time. This includes wait time before Elasticsearch services the request.
Average 99th percentile latency across multiple runs:
- Amazon Web Services: 10,808.44 ms
- Google Cloud Platform: 7,741.14 ms
- Microsoft Azure: 7,682.26 ms
Conclusion
Maximum indexing throughput results:
- 3 nodes on AWS: 12,900 events/s
- 3 nodes on GCP: 17,256 events/s
- 3 nodes on Azure: 22,990 events/s
Geoname Index
Benchmark data: Metricbeat with the following specifications:
- Total documents: 11.4 million
- Data volume: 1.1 GB
The test also measures the time from request submission to complete response. This interval includes the wait time before Elasticsearch services the request.
The average 99th percentile latency across multiple runs was:
- Amazon Web Services: 7,080.53 ms
- Google Cloud Platform: 8,298.98 ms
- Microsoft Azure: 5,253.86 ms
Conclusion
Maximum indexing throughput values are:
- The 3-node AWS configuration processed 35,256 events per second
- GCP (3 nodes) processed 29,170 events per second.
- Azure (3 nodes) processed 41,417 events per second.
Search Benchmark
We measured the 90th percentile service time for various search queries.
Metricbeat Index
- Auto Date Histogram
- Auto Data Histogram with Time Zone
- Date Histogram
- Date Histogram with Time Zone
GeoNames Index
- Default
- Term
- Phrase
- Population: Descending sort
- Population: Ascending sort
- asc_sort_geonameid
- desc_sort_geonameid
Search benchmarks show Azure service times are 6 to 7 times higher than AWS and GCP.
Conclusions: Elastic Cloud on AWS, GCP and Azure
To summarize the experiment,
Indexing benchmarks show higher document rates for Azure than for AWS and GCP on both Metricbeat and GeoNames workloads. However, latency data suggests indexing rates were likely similar across all three providers, given comparable latency profiles.
Search benchmarks indicate that the Azure Elasticsearch cluster lacks the NVMe storage performance available on AWS and GCP. This hardware difference is the primary factor resulting in query service times 6 to 7 times higher on Azure.
The benchmark results indicate that the current Elastic Cloud infrastructure on Azure cannot match the search performance of AWS and GCP. Additionally, AWS pricing is lower than GCP and Azure pricing for equivalent workloads.
Elastic Cloud continuously upgrades underlying infrastructure. Performance parity across AWS, GCP, and Azure service offerings is expected as hardware upgrades roll out.
If you are planning a move to Elastic Cloud, see our Elastic migration services.
Related reading: LogsDB full-text search benchmarks and Elasticsearch capacity planning.
References:
[1] https://www.elastic.co/guide/en/cloud/current/ec-getting-started-profiles.html#ec-profiles-compute-optimized
[2] https://www.elastic.co/blog/benchmarking-and-sizing-your-elasticsearch-cluster-for-logs-and-metrics
[3] https://esrally.readthedocs.io/en/stable/
[4] https://www.elastic.co/guide/en/cloud/current/ec-default-aws-configurations.html
[5] https://www.elastic.co/guide/en/cloud/current/ec-default-gcp-configurations.html
[6] https://www.elastic.co/guide/en/cloud/current/ec-default-azure-configurations.html