
Function of Data History Playback in Looker
Data History Playback is a Looker feature that animates visualizations across time. It replays data step by step to show how metrics changed across days, weeks, or months.
Standard dashboards display current performance. They provide a snapshot of present status. They do not show how data evolved over time. Users must manually adjust filters or export data to view historical changes.
Data History Playback in Looker animates visualizations across time. The tool replays data step by step. It reveals how metrics changed across days, weeks, or months. This feature helps teams understand trends and communicate insights clearly.
Playback is temporary and supports exploration. When the animation stops, the chart restores its original static view.
Time-Based Playback Improves Trend Analysis
Time-based animation provides clarity that static charts miss. Trends become easier to recognize. Patterns stand out. Insights emerge faster.
Key advantages:
1. Clearer trend discovery
Animation shows trends over time. It reveals seasonality, recurring patterns, or sudden changes that are difficult to identify in a static chart.
2. Clearer stakeholder communication
Playback demonstrates how performance changed during specific time periods, such as product launches or promotional cycles.
3. Easier data exploration
Movement in the data helps users understand cause and effect. It removes the need to infer results from static tables.
4. Improved period-over-period analysis
Playback identifies variance between comparable periods. Examples include quarter-over-quarter, week-over-week, and year-over-year. This supports clearer reporting.
The feature supports intuitive data interaction. It supports decision-making with higher confidence.
Enable Data History Playback in Looker
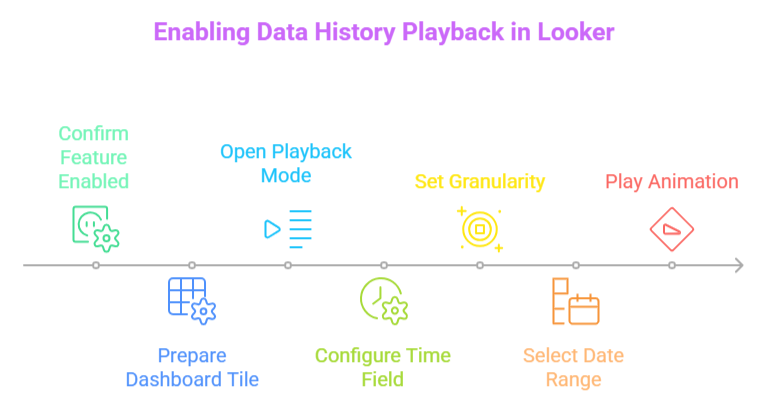
The following steps describe how to configure playback in a Looker dashboard.
Step 1: Verify Feature Status
Go to: Admin > General > Settings > Data History Playback.
Confirm the status is Enabled. If disabled, select Enabled and save.
Step 2: Configure Dashboard Tile
Playback requires a tile containing a valid time dimension.
Options:
- Use an existing tile with a Date, DateTime, or Timestamp field, or
- Create a new tile in Explore
Create a new tile:
- Open Explore
- Add a time dimension
- Add at least one measure
- Select a chart type (line, bar, or area)
- Run the query
- Save the tile to a dashboard
Looker animates tiles only when the selected range contains time series data.
Step 3: Enable Playback Mode
- Open the dashboard
- Select the tile menu
- Choose Data History Playback
If the option is unavailable, the feature is disabled or the tile lacks a valid time field.
Step 4: Configure Time Fields and Playback Settings
In playback mode, you can set:
Time Field
Select the date or timestamp field that drives the animation.
Granularity
Select the time step for the animation:
- Day
- Week
- Month
- Quarter
- Year
Date range
Select a preset:
- Last 7 days
- Last 30 days
- Last 3, 6, or 12 months
- Year-to-date
- Previous year, or select a custom range in the date picker.
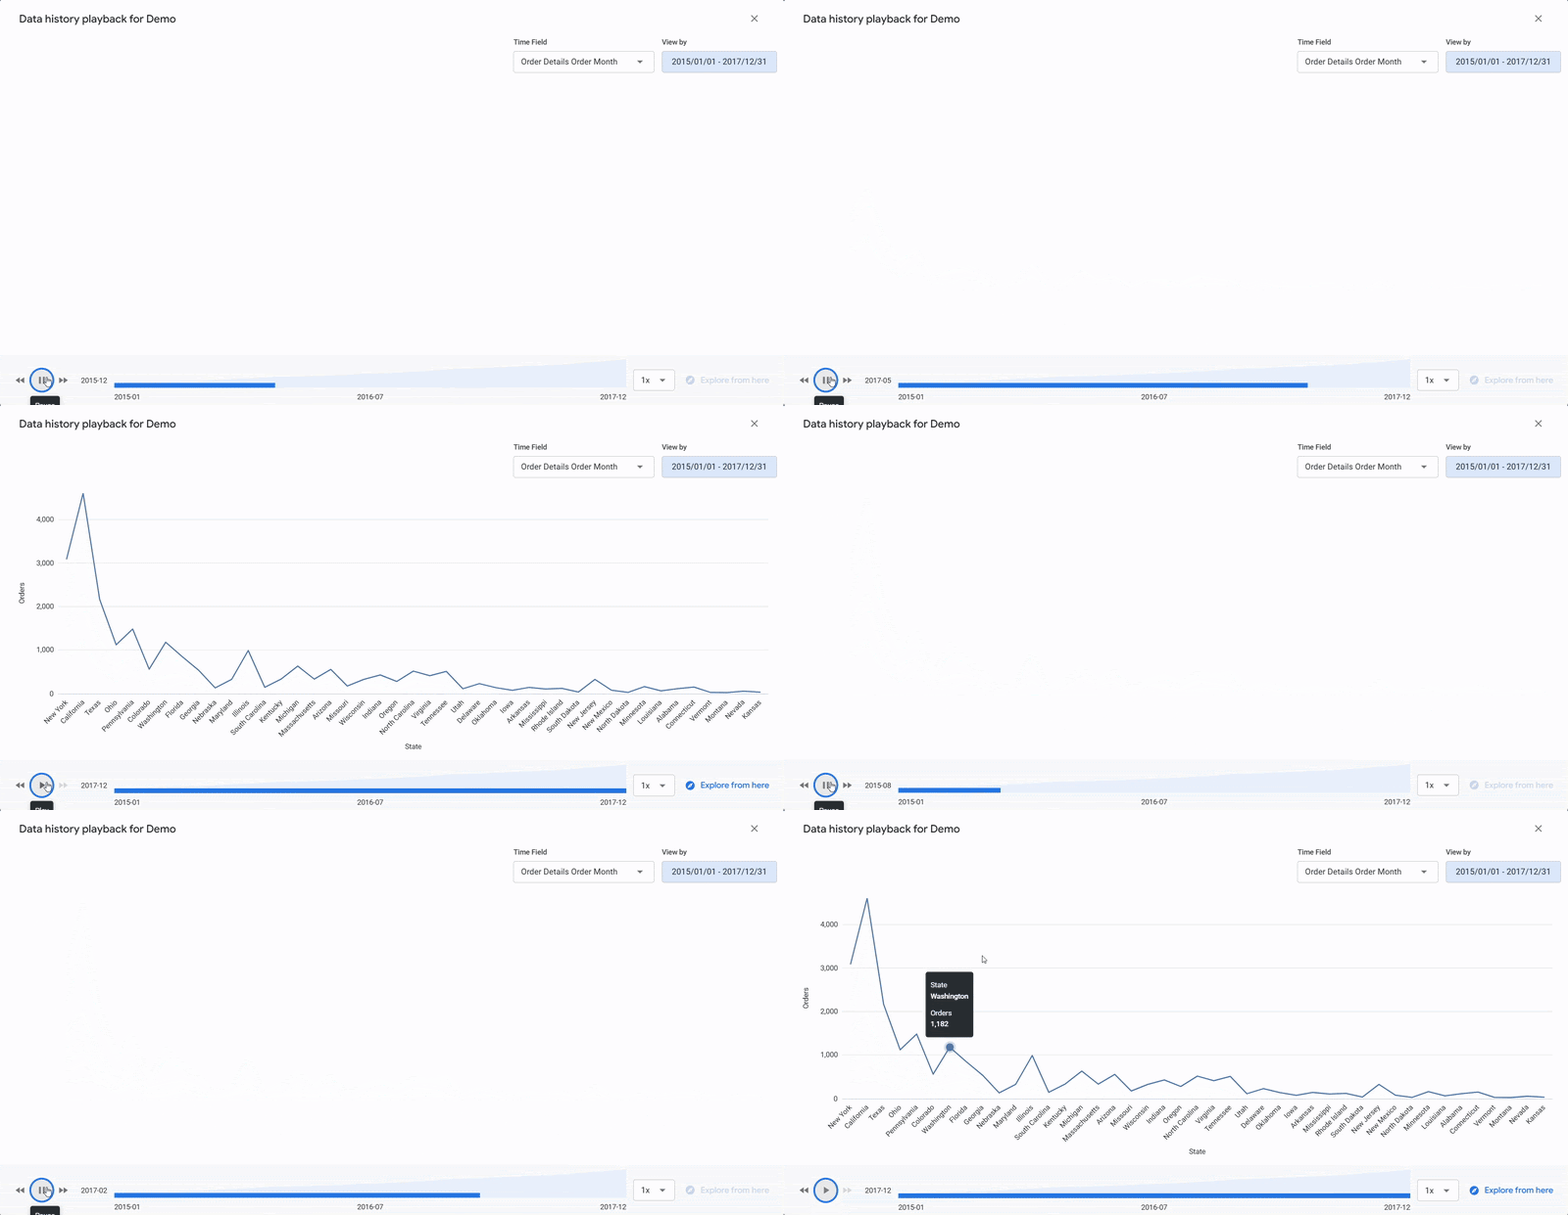
Select Play to animate the chart.
Data History Playback in Looker: Supported Visualization Types
Data History Playback supports the following native Cartesian visualizations:
- Column
- Bar
- Line
- Area
- Scatter Plot
Looker does not support custom visualizations.
These chart types support clear time-based analysis with smooth playback.
Practical Use Cases for Data Playback in Looker
Retail
Track monthly sales trends to detect seasonal peaks, measure campaign performance, and monitor inventory cycles.
Web and Marketing Analytics
Analyze traffic shifts across campaigns, product launches, and market changes.
Manufacturing and Operations
Observe production output trends to measure efficiency and identify bottlenecks.
Finance and Accounting
Visualize quarterly revenue or expense shifts to reveal trends and turning points.
Playback assigns a clear timeline to each metric. This format explains changes to stakeholders and supports faster decisions.
Benefits of Looker Playback for Time Series Analysis
| Capability | Business Advantage |
|---|---|
| Animated time progression | Makes trend discovery easier |
| Native Looker feature | No external tools required |
| Uses existing dashboard tiles | Fast to adopt and implement |
| Configurable granularity | Supports short term and long term analysis |
| Ideal for presentations | Helps communicate insights clearly |
For help with Looker dashboards, see our advanced Looker analytics services.
Related guides: how to compare metrics across time in Looker and how to use forecasting in Looker.