
Why Compare Metrics Across Time in Looker?
Current performance data shows status, not direction. To assess growth, stability, or decline, compare current metrics against historical performance.
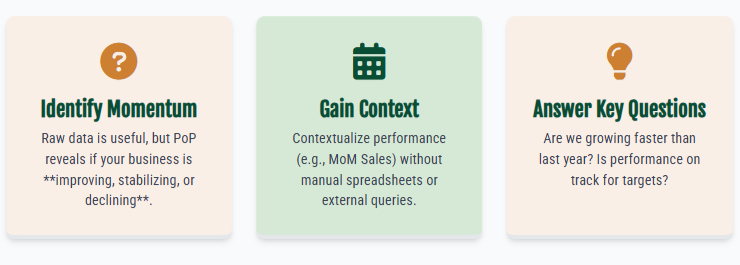
Looker Period-over-Period (PoP) analysis automates this process. It computes MoM, QoQ, and YoY comparisons within an Explore. This removes the need for manual spreadsheets or external SQL queries.
Comparing current sales to last month or current revenue to last year provides context that single values cannot show. Period-over-Period (PoP) analysis measures this change.
Definition of Period-over-Period Analysis
Period-over-Period analysis measures metric change between two equivalent time periods. Looker aligns current and previous periods using time dimensions.
PoP comparison examples:
- Current month vs. previous month
- Compare the current quarter to the prior quarter
- Compare the current year to the prior year
Compare year-to-date progress to the same period in the prior year
Looker calculates these metrics:
- Current period value
- Prior period value
- Absolute variance
- Percentage change
This method presents a full performance view without manual calculation.
Value of Period-over-Period Metrics
Raw data records past events. Time-based comparisons identify trends. Period-over-period metrics help teams answer:
- Are performance metrics improving or declining?
- How does the current month compare to the prior month?
- Is growth rate exceeding the prior year?
- Is performance on track for targets?
Period-over-Period (PoP) metrics show trend direction. They isolate values from noise. This reduces manual work. Looker aligns periods. It manages time intelligence. It matches historical data.
Constructing Period-over-Period Measures in Looker
PoP measures require three inputs. Set the base metric. Set the time dimension. Set the comparison period. Align these in LookML. Looker calculates values for all equivalent periods.
Step 1: Define the LookML Measure
Build a PoP measure with:
- A base metric. Example: orders.count.
- A time field that defines the comparison period.
Key LookML parameters:
based_on: The metric for analysis. Example: total orders.
based_on_time: The time dimension used for period alignment. Example: order date.
period: The comparison interval. Options include year, quarter, month, or week.
kind: The calculation type. Options include previous value, difference, or percentage change.
Looker generates the full set of PoP values automatically.
Step 2: Select the Period Type
Period comparisons vary by reporting requirement. Common examples include:
| Period Type | What It Compares | Example |
|---|---|---|
| YOY (Year over Year) | Current year vs previous year | March 2025 vs March 2024 |
| QTD (Quarter to Date) | Current quarter to previous quarter | Q1 2025 vs Q4 2024 |
| MTD (Month to Date) | Current month to previous month | March 2025 vs February 2025 |
| YTD (Year to Date) | Current year-to-date vs previous | Jan–Mar 2025 vs Jan–Mar 2024 |
| PYTD (Previous Year to Date) | Last year’s progress vs earlier year | Jan–Mar 2024 vs Jan–Mar 2023 |
Step 3: Apply value_to_date for Year-Over-Year Date Alignment
Enable the following parameter to compare periods ending on the same date across years:
value_to_date: yes
If the current date is June 6, 2025, Looker compares the following periods:
- January 1 to June 6, 2025
- January 1 to June 6, 2024
This step ensures accuracy for Year-to-Date and similar analyses.
Step 4: Visualize Period-over-Period Results
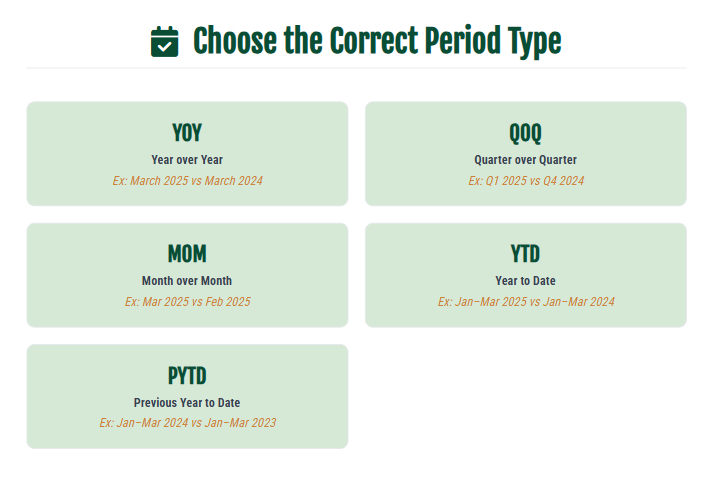
Table visualizations provide the clearest view of PoP measures. They display the following data:
- Current period value
- Value from the prior period
- Difference between periods
- Percent change
Use line charts or bar charts if axes show period alignment. Example: 2025 versus 2024.
Use Cases by Team
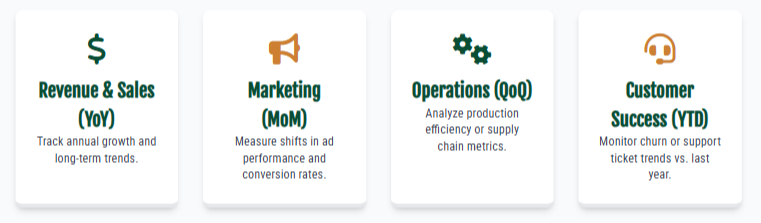
Period-over-period (PoP) analysis supports decisions across business functions.
Revenue and Sales: Year-over-Year
Track annual growth. Identify performance trends between the same months in consecutive years.
Marketing: Month-to-Date
Measure changes in ad performance, conversions, or spend. Compare current month data to prior month data.
Operations (Quarter-to-Date)
Track factory output, supply chain, and production efficiency by quarter.
Customer Success (Year-to-Date)
Compare churn, retention, and support ticket trends to the prior year.
Period-over-Period measures identify performance direction and momentum.
Looker Period-over-Period (PoP) measures simplify trend analysis. Analysts evaluate performance changes directly in an Explore. This removes the need to export data or build manual comparisons.
Use PoP analysis to track year-over-year growth, month-over-month shifts, and quarterly progress. This method supports continuous performance monitoring. It shows how metrics change over time. Tracking change often provides more insight than absolute values. Looker measures this change with minimal setup.
For more advanced LookML work, see our advanced Looker analytics services.
Related guides: how to use forecasting in Looker and how to use data history playback in Looker to visualize change over time.