
The Value of Looker Forecasting
Standard dashboards report historical data. They show previous revenue, traffic, or conversion metrics. This data is useful. It does not support proactive planning.
Teams must identify probable future outcomes.
Looker Forecasting Graphs solve this problem. They extend historical data into the future using built-in predictive models. You do not need Python notebooks, spreadsheet exports, or external tools. All processes occur within Looker.
Forecasting shifts analytics from describing past data to predicting future patterns. This capability improves planning, budgeting, and operational decisions.
Definition of Looker Forecasting
Looker Forecasting uses internal statistical models to project future values. These models analyze patterns in existing data. When enabled, Looker examines trend lines, seasonal cycles, and historical changes. It then predicts values for future periods.
Chart Types That Support Forecasting
Forecasting supports these visualization types:
Cartesian charts
- Line charts
- Area charts
- Column charts
- Bar chart
- Scatter plot
Text and table visuals
- Single value
- Table
- Table Legacy
- Word Cloud
Note: Community visualizations do not support forecasting.
Forecasting runs inside existing charts. This maintains workflow continuity.
The Value of Forecasting in Looker for Business Teams
Forecasting changes team decision-making and execution. It provides the following practical value:
1. Plan Ahead With Confidence
Forecast revenue, traffic, engagement, or demand. Act on expected outcomes. Eliminate reactive patterns.
2. Build Realistic Targets
Use predicted values as the baseline for KPIs, OKRs, and capacity planning.
3. Detect Anomalies Early
Compare forecasts with actuals. Identify unusual deviations before they impact operations.
4. No Technical Skills Required
Enable forecasting within the Looker interface. Users of all skill levels can perform these tasks.
Forecasting enables organizations to act proactively rather than reactively.
Looker Forecasting: Step-by-Step Configuration Guide
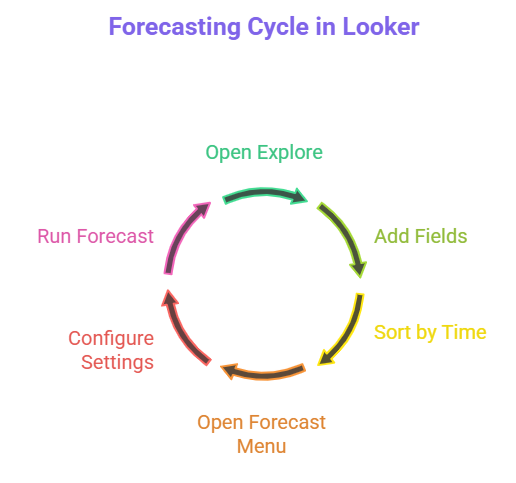
To forecast in Looker, open an Explore with one time dimension and one to five measures, enable dimension fill, open the Forecast panel, set the field, length, prediction interval and seasonality, then run the forecast. The steps follow.
1. Open an Explore
Select a dataset that contains a time-based field (Date, Week, or Month).
2. Add Fields
The query must include the following components:
- One time dimension
- Between one and five measures
Enable dimension fill for the time dimension.
3. Sort by the time field
Sort the Explore in descending order to display the most recent data first.
4. Open the Forecast menu
Locate the Forecast panel in the visualization settings.
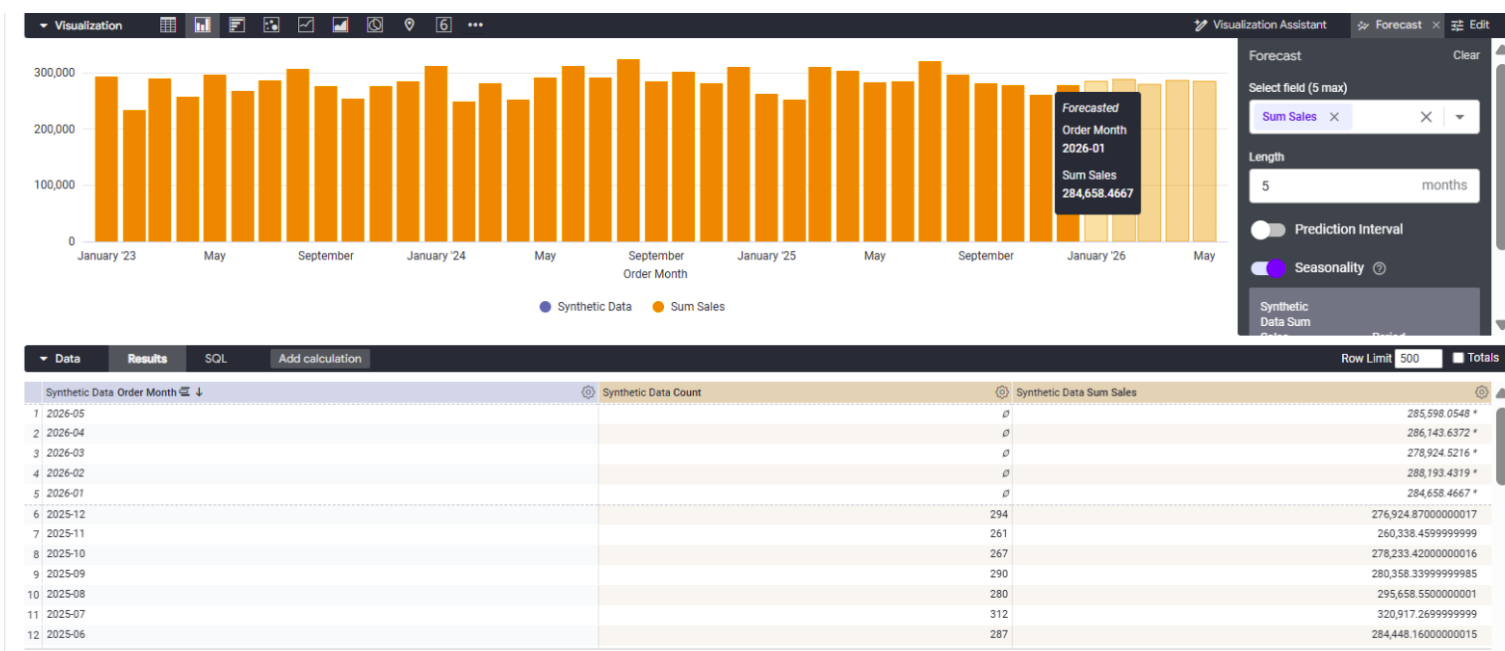
5. Configure Forecast settings
Select Field: Choose the measure or measures to forecast.
Length: Set the forecast horizon (for example, 5 days, 3 weeks, or 6 to 12 months).
Prediction Interval: Enable to display confidence ranges around forecast values.
Seasonality Settings
- Automatic: Looker detects repeating patterns.
- Custom: Set the cycle length (for example, 12 for monthly seasonality).
- Forecasting: Trend-Only Models Without Cycles
6. Execute the Forecast
Looker displays the following outputs:
- Forecasted values
- Trend continuity
- Add prediction intervals (optional)
The dashboard displays historical results and future projections.
Example Use Cases
Sales Forecasting
Predict next month’s revenue, order volume, or pipeline status.
Marketing Analytics
Forecast traffic, conversions, and campaign performance directly within Looker.
Inventory and Demand Planning
Adjust stock levels and procurement using demand forecasts.
Customer Support
Predict ticket volume and plan staffing based on projected workload.
Use these predictions to make timely decisions and align resources with future needs.
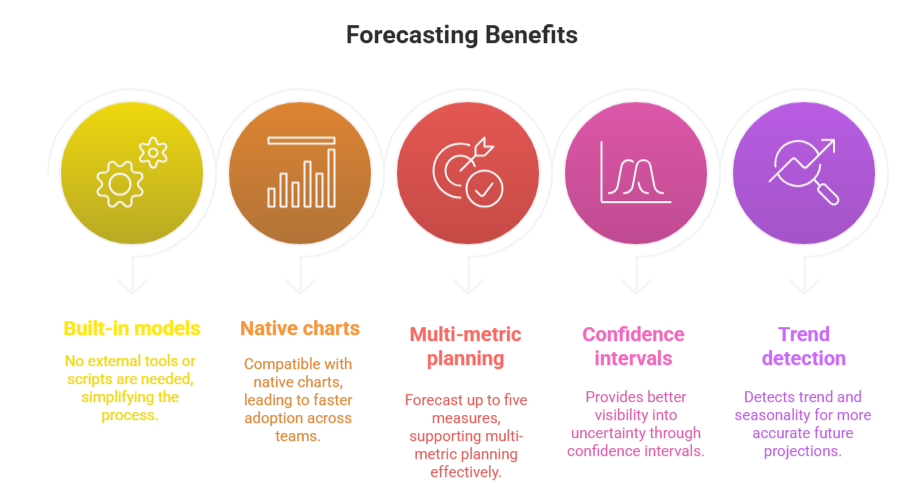
Key Benefits
| Capability | Business Advantage |
|---|---|
| Built-in forecasting models | No external tools or scripts needed |
| Compatible with native charts | Faster adoption across teams |
| Forecast up to five measures | Supports multi-metric planning |
| Confidence intervals | Better visibility into uncertainty |
| Trend and seasonality detection | More accurate future projections |
For help with forecasting and other Looker analytics, see our advanced Looker analytics services.
Related guides: how to compare metrics across time in Looker and how to use data history playback in Looker.