
What are Looker Studio community visualizations?
Looker Studio Community Visualizations extend native charting capabilities.
- Standard visuals (bar, line, pie) meet baseline reporting needs.
- Complex data and branded styles require custom options.
Users import, configure, and develop charts to support these requirements.
Configure Your First Looker Studio Community Visualization
1. Open the Report
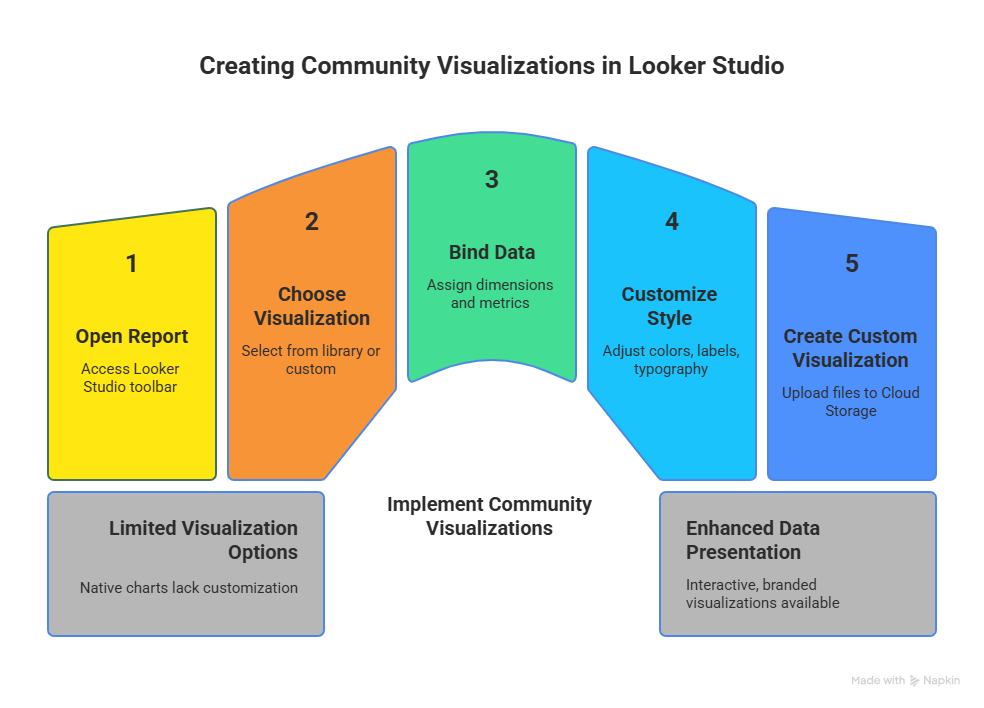
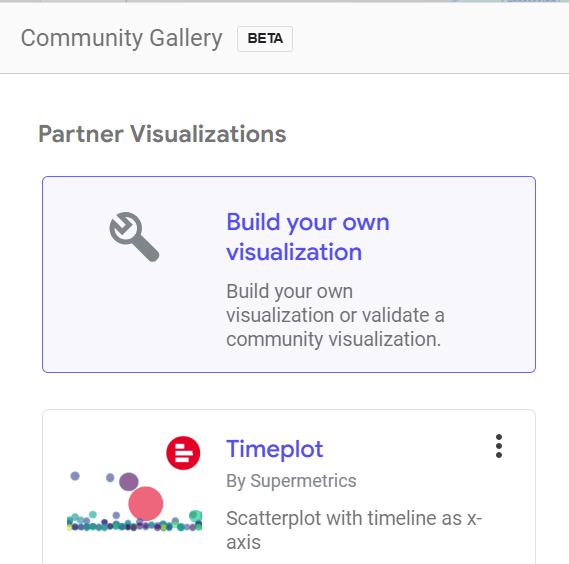
Open the target report in Looker Studio. From the toolbar, select: Add a chart → Community visualizations → Explore more.
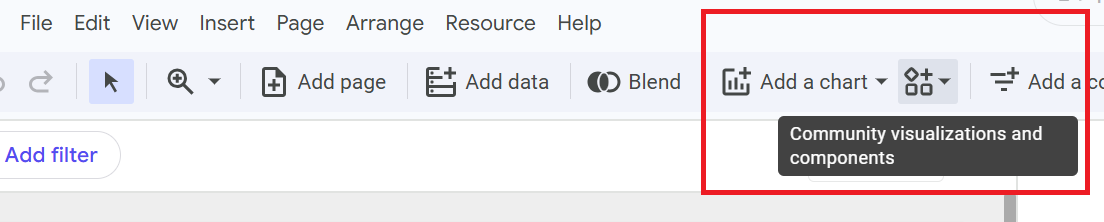
The Community Visualizations gallery displays pre-built assets from Google and external contributors.
2. Select a Visualization
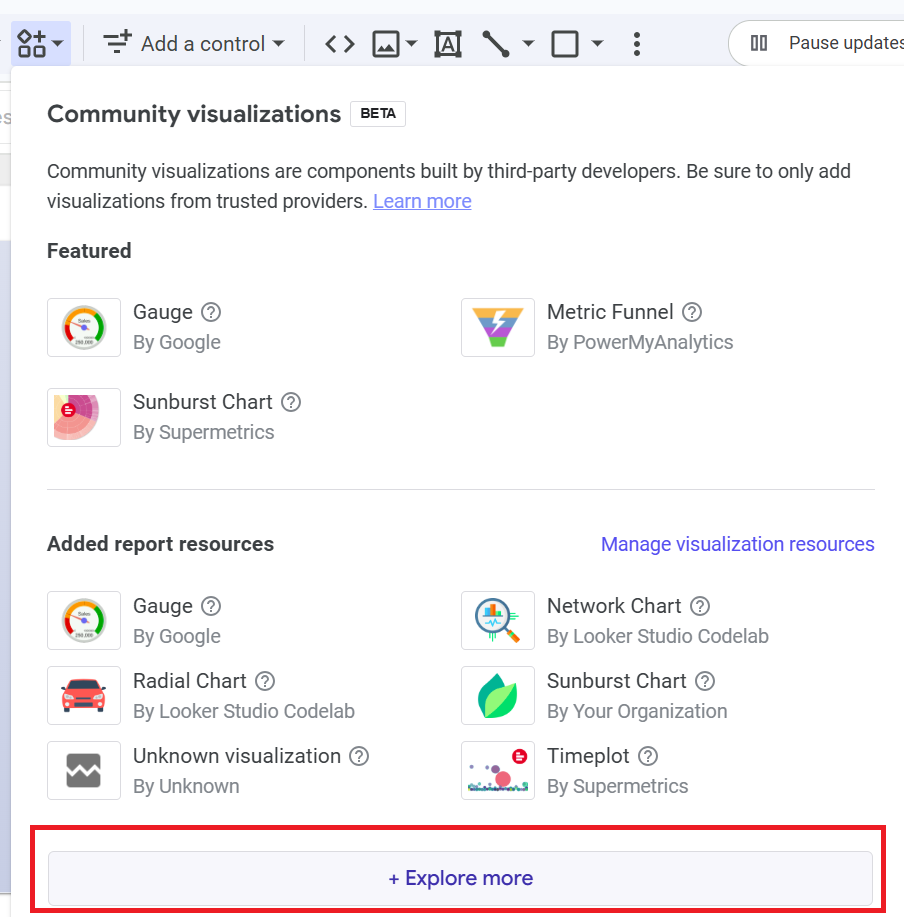
You can:
- Select a visualization from the Google Community Library, or
- Add a custom visualization by entering its manifest URL.
Google validates approved visualizations for compatibility and performance in Looker Studio. The manifest URL option allows teams to import external visualizations, such as those built with JavaScript and JSON.
3. Bind Data
Bind the dataset to the visualization. This follows the same process as native charts:
- Assign dimensions to define categories or groupings.
- Add metrics to define numerical measures.
Once fields are linked, the visualization updates to reflect the underlying data in real time.
4. Customize the Style
Use the property panel to set design elements. Adjust colors, labels, fonts, and layout to match the dashboard theme.
Many visualizations support interactivity. Options include hover effects, filters, and animations. Users can explore data dynamically.
This flexibility aligns analytics presentation with brand identity and data storytelling goals.
5. (Optional) Create a Looker Studio Custom Visualization
For full control, take these steps:
- Upload visualization files (HTML, JS, JSON) to Google Cloud Storage.
- Add the manifest path in Looker Studio.
- Test the visualization in your report.
You can create a custom, interactive chart in minutes.
Application Scenarios: Value of Community Visualizations
Marketing and Digital Performance
Marketing teams use funnel charts and radial visuals to track campaign performance. These formats clarify audience conversion paths. Stakeholders identify stages that require optimization.
Operations and Supply Chain
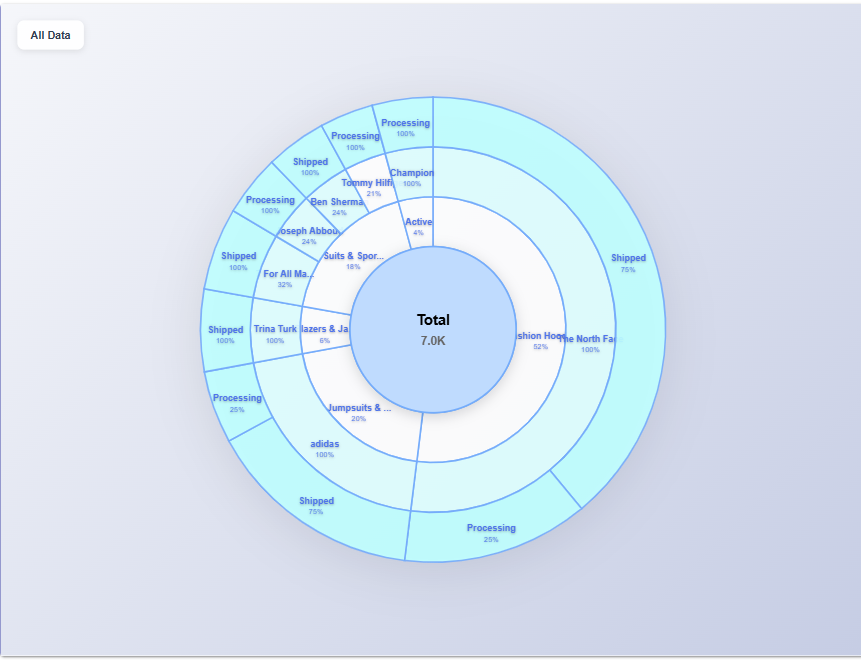
Operational dashboards use sunburst charts and resource allocation maps. These provide visibility into process hierarchies, asset distribution, and utilization levels across business units.
Finance and Accounting
Finance professionals use waterfall and treemap charts to display profit and loss structures. These visuals support clear executive communication of key financial indicators.
Data Science and Analytics
Analytics teams use community visualizations to prototype new chart types before production integration. This approach accelerates visualization innovation without disrupting core BI workflows.
Business Benefits of Community Visualizations
| Feature | Business Impact |
|---|---|
| Custom Design Freedom | Aligns chart design with brand guidelines or unique data models |
| Interactivity and Animation | Enhances engagement and encourages user-driven analysis |
| Seamless Looker Integration | Works like native charts within existing dashboards |
| Scalable Development | Allows teams to share and reuse visualization code across projects |
| Faster Storytelling | Reduces the time needed to turn insights into actionable decisions |
Implementation Best Practices
- Use Community Visualizations before creating custom code. Many pre-built options meet common business needs.
- Verify performance and compatibility with external manifests. Ensure custom scripts load efficiently and meet organizational security requirements.
- Document visualization settings to maintain consistency across reports, particularly in multi-team environments.
Iterate on designs and gather feedback to confirm that visualizations communicate intended insights.
Conclusion
Looker Studio Community Visualizations extend the data reporting capabilities of the platform. They combine the ease of Looker's drag-and-drop interface with the flexibility of open web technologies. For organizations that require advanced visual analysis, these tools provide:
- Deeper data insights
- Faster reporting iteration
- Stronger brand alignment
Whether the goal is to visualize marketing funnels, operational hierarchies, or financial flows, community visualizations present data in meaningful and consistent ways. This capability transforms static reports into interactive analytical tools that improve decision-making.
For help with Looker reporting beyond Looker Studio, see our advanced Looker analytics services.
Related guides: how to use Looker Studio templates to build dashboards faster and how to use the Looker Excel connector for direct data access in Microsoft Excel.