
Tableau leads business intelligence for visual data exploration. The tool is powerful, intuitive, and accessible. Non-technical users create dashboards using drag-and-drop features in minutes. This process reveals patterns and trends hidden in spreadsheets. Tableau is an effective tool. Its market success is justified by its utility.
As your business scales, friction increases. The speed and flexibility of ad-hoc analysis become sources of technical debt. You face barriers in data consistency, governance, and report delivery. You are evaluating Looker. This is the correct question: Is it time to change?
Squareshift guides organizations through this decision. As a certified GCP partner specializing in Tableau to Looker migration, we evolve BI strategies. We move from isolated insights to a unified, scalable platform.
This guide provides a strategic analysis. It details how Looker architecture addresses Tableau limitations at the enterprise level. It explains how migration unlocks team capability.
Short answer: Tableau serves ad-hoc visual exploration. Looker supports modern enterprises that need governed, real-time and scalable data.
What Is the Difference Between Looker and Tableau?
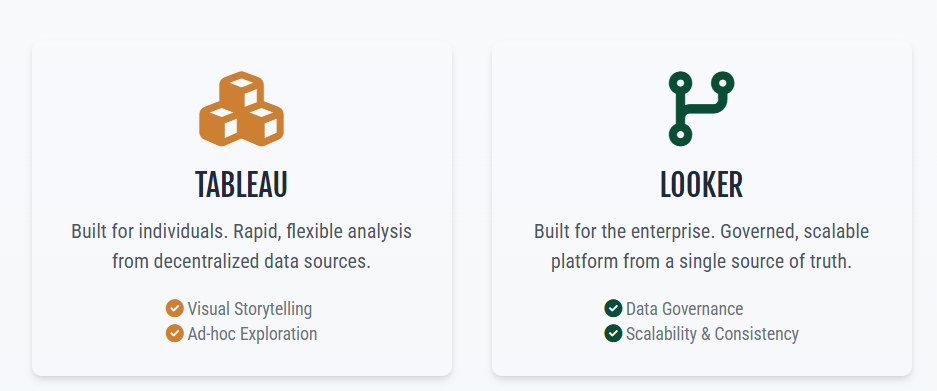
The core distinction lies in the data layer, not the dashboards. Both platforms are powerful BI tools. Their fundamental philosophies differ. These differences define enterprise strengths and weaknesses.
This table compares key features to support your decision between Tableau and Looker.
| Feature | Looker (Google Cloud Core) | Tableau |
|---|---|---|
| Primary Strength | A unified, governed semantic layer ( LookML ) ensuring a single source of truth across the organization. It's built for data consistency and scalability. | Exceptional data visualization and storytelling capabilities with a highly intuitive, drag-and-drop interface . It's built for rapid, flexible ad-hoc analysis. |
| Data Modeling | LookML is a proprietary, code-based language for defining data relationships, dimensions, and metrics. It creates a powerful, reusable data model that is centrally managed and version-controlled. | In-memory/On-the-fly : Less formal modeling. Users can perform data blending and transformations on the fly. It's flexible but can lead to inconsistent metrics across different reports and dashboards. |
| Ideal User Profile | Data Engineers and Analysts: It's perfect for organizations with a robust data team that wants to build a standardized data platform. It's also ideal for companies that prioritize data governance and a single source of truth . | Business Analysts and Data Consumers: Best for users who need to quickly explore data and build interactive dashboards for presentations and reports. It's a great tool for organizations that prioritize visual storytelling. |
| Governance & Standardization | Strong. LookML acts as a single, centralized source of truth for all business logic and definitions. This ensures every user is working with the same, trusted data and metrics. | Weaker. While it offers some governance features, it is often a manual process. The lack of a centralized semantic layer means different users can create different logic, leading to "dashboard sprawl" and inconsistent data. |
| Scalability | Designed to scale with the underlying cloud data warehouse (BigQuery, Snowflake, etc.). It can handle massive datasets by pushing the processing to the database. | Scalable through a distributed server architecture, allowing you to add more server nodes. However, performance can still be a concern with very large datasets. |
Why Looker Serves Enterprise BI Requirements
Architecture determines performance and scalability. This impact grows with data volume.
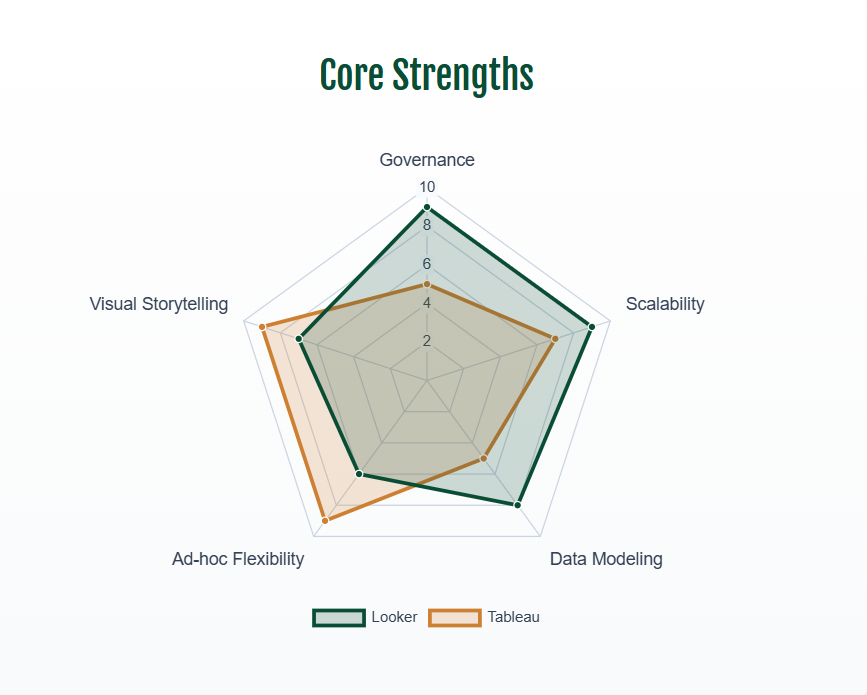
Tableau users often rely on data extracts to speed up dashboards. Extracts work for small, static datasets. They cause stale data and high management overhead. Analysts wait for refreshes and optimize workbooks. They do not drive insights. For cloud-native businesses, this model limits speed.
Looker uses a cloud-native architecture. It does not move data. It queries the database directly. Processing occurs in the cloud data warehouse. Users access real-time data. Performance scales with the data stack, not the BI tool. As a GCP partner, we confirm that Looker integrates natively with BigQuery. This integration creates a scalable environment for large, dynamic datasets. Looker uses the compute power of the data warehouse. This model provides speed and efficiency that extract-based models do not offer.
Tableau vs. Looker: Core Architectural and Strategic Differences
This section compares key architectural differences between Tableau and Looker. It explains the operational impact of each model on business performance.
Data Modeling and Governance
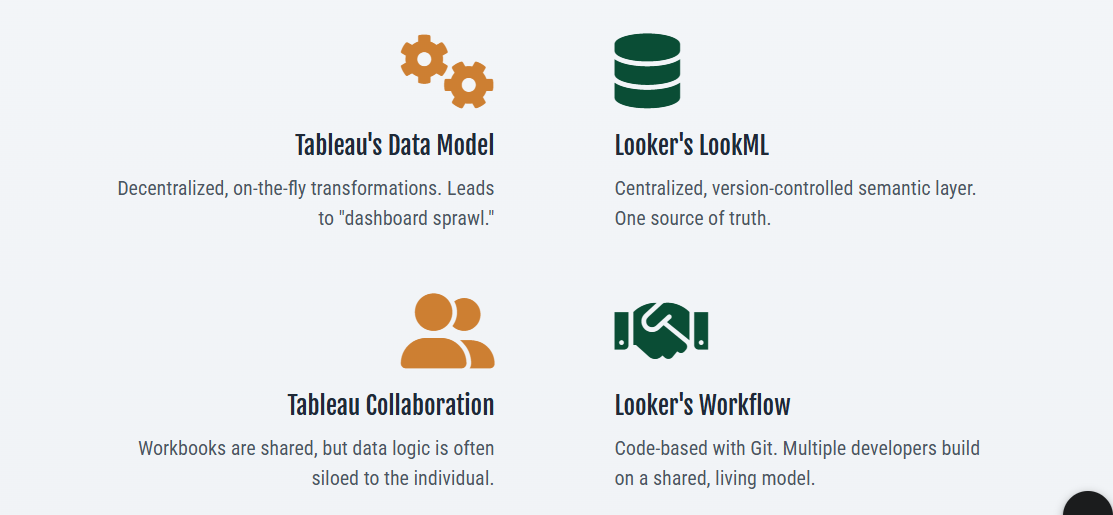
- Looker uses LookML, a code-based language, to define data relationships, dimensions, and metrics. Data engineers build reusable, centrally managed models. These models use Git for version control. This structure ensures all users apply identical definitions for metrics, such as "New Customers" or "Average Order Value." This consistency supports a reliable, data-driven organizational culture.
- Tableau uses a decentralized workbook model. Analysts create workbooks by blending data sources and applying custom logic. This model supports rapid individual exploration. However, it often results in "dashboard sprawl" and inconsistent metric definitions across the organization.
Collaboration and Development
- Looker’s Collaborative Approach - LookML is a code-based language. - Developers can work on the same model simultaneously. - Version control systems manage these changes. - This structure supports large data teams. - The process creates a shared, living data model.
- Tableau’s Collaborative Tools - Tableau provides strong features for sharing dashboards and reports. - Data logic often resides within individual workbooks. - A centralized data modeling layer is absent. - This makes it difficult to maintain a single source of truth. - Collaboration is limited to output sharing rather than model governance.
Ease of Use for Different Users
- Looker’s Two-Tiered System - Setup requires a technical data professional. - This role builds the LookML model. - The front end is intuitive once the model exists. - Business users can explore, filter, and drill into data. - No SQL skills are required for end users. - This structure enables self-service analysis with trusted data.
- Tableau Interface: Users create visualizations with minimal training using the drag-and-drop interface. However, complex analysis requires advanced technical skill. Senior analysts often create complex dashboards.
Looker vs Tableau Pricing: Total Cost of Ownership (TCO)
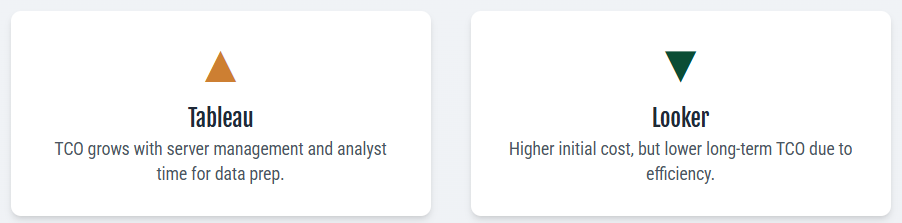
- Looker TCO: Initial implementation requires professional services to build the LookML model. Long-term TCO is often lower. Centralized models reduce time spent reconciling reports and preparing data. This efficiency supports data strategy scale without additional headcount, reducing costs.
- Tableau TCO: The per-user license model is simple. TCO increases rapidly and unpredictably as the organization scales. Costs include server infrastructure management, analyst time for data preparation, and report reconciliation.
SquareShift Expertise: Migrating to Looker
You selected Looker as your strategic BI platform. You must now manage your existing Tableau assets.
Organizations worry about losing value in established Tableau environments. They fear migration causes data or logic loss.
SquareShift uses a strategic, data-driven methodology for Tableau to Looker migration. This process is not a simple lift-and-shift. It ensures a seamless transition. Our proven process includes:
- Discovery & Auditing - Conduct a comprehensive audit of the Tableau environment. - Analyze workbook usage. - Identify key business logic. - Map dependencies. - Exclude unused dashboards. - Capture all critical logic.
- Strategic Translation - Translate business logic into a governed LookML model. - Ensure the model is clean and reusable. - Automate the translation process using proprietary tools. - Maintain accuracy. - Reduce manual effort.
- Validation and User Adoption: After deploying Looker dashboards, we verify results against Tableau data. We deliver a change management plan with training to ensure user confidence and adoption.
Partnering with SquareShift modernizes your data stack. We reduce manual effort and accelerate timelines. This approach delivers rapid value and ensures data integrity.
Planning the move? Read our ultimate guide to Tableau to Looker migration and our tips to recreate Tableau dashboards in Looker.
Conclusion
Tableau serves ad-hoc visual exploration. Looker supports modern enterprises requiring governed, real-time, and scalable data cultures. This platform invests in long-term data governance and data-driven operations.
Migration depends on business readiness. It reflects the need to advance to the next stage of your data journey.
Select a migration partner that optimizes the full capability of your enterprise data stack.
Contact SquareShift for a free consultation to define your migration strategy.
We create a roadmap for a consistent, scalable, and high-performance data environment.
Frequently Asked Questions
Does Looker outperform Tableau on large datasets?
Yes. Looker uses a cloud-native architecture. It queries the cloud data warehouse directly. It pushes processing to the database. This method leverages raw compute power. It improves performance and scalability for massive datasets.
How does Looker improve data governance?
Looker uses LookML. This is a code-based language. It defines data relationships and metrics. It centralizes business logic. It uses Git for version control. This ensures every user uses the same metric definitions. It establishes a data-driven culture.
Will migrating to Looker increase long-term costs?
Initial setup may require professional services. However, the centralized model lowers long-term Total Cost of Ownership (TCO). It reduces time spent on data preparation and reconciliation. Teams focus on higher-value work and insight generation.
Why choose a specialized partner like SquareShift?
Specialized partners reduce error and delay risks. SquareShift is a certified Google Cloud Partner. We use proven processes. We automate complex tasks. This ensures accuracy and saves time. We modernize data strategy, not just migrate it.
Is Looker similar to Tableau?
Both are powerful BI tools, but their philosophies differ. The core distinction lies in the data layer, not the dashboards. Looker uses LookML, a code-based semantic layer, for governed and reusable definitions. Tableau uses a decentralized workbook model that supports rapid individual exploration but often leads to inconsistent metric definitions.
Is Looker better than Tableau?
It depends on what you need. Tableau serves ad-hoc visual exploration, and non-technical users build dashboards with drag and drop. Looker supports enterprises that need governed, real-time and scalable data. Looker setup needs a technical data professional to build the LookML model. Business users then explore without SQL.
How do Looker and Tableau compare on cost?
Tableau uses a simple per-user license model, but total cost of ownership grows as the organization scales. Costs include server management, analyst data preparation and report reconciliation. Looker implementation needs professional services to build the LookML model. Long-term cost is often lower because centralized models reduce reconciliation time.