
Migration from Tableau to Looker requires more than data transfer. It requires a structural redesign. This approach preserves analytical core functions. It also improves speed, clarity, and user experience. Teams gain cleaner, faster, and more scalable reporting capabilities.
Visual Differences in Tableau to Looker Migration
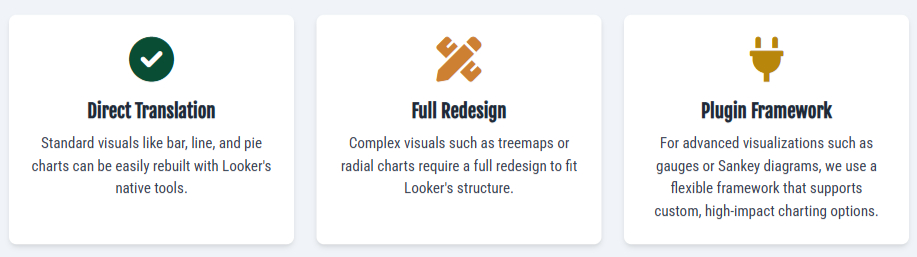
Standard charts, such as bar, line, and pie charts, migrate with minimal effort. Rebuild these using Looker native visualization tools to maintain metric consistency.
Complex visuals, including treemaps and radial charts, require full reconstruction. Use this phase to remove redundant elements and retain only those that support decisions.
For scenarios where native visuals are insufficient, utilize the Looker plugin framework.
Explore the Tableau to Looker migration process →
Differences in Interactivity and Filtering Behavior
Recreating Tableau dashboards in Looker requires adapting interactivity to the platform's architecture. Tableau supports spontaneous adjustments via filters, sets, and parameters. Looker defines behavior in LookML before exposing controls to users.
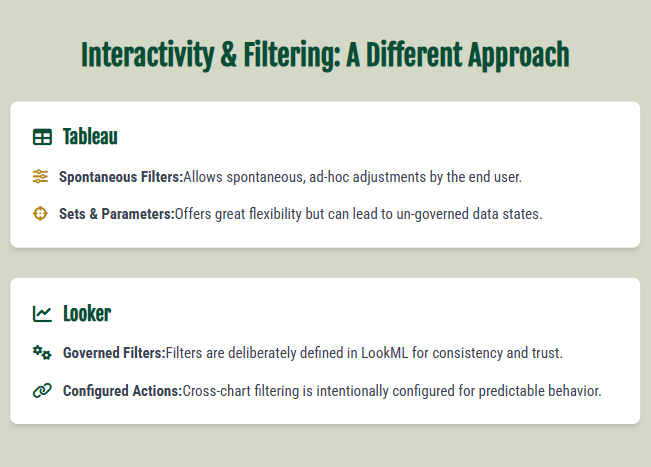
Write conditional filters into the model to govern data subsets. Configure cross-chart filtering to update linked charts on click. Define parameter values during migration. Model set-based actions in LookML to maintain capability and stability.
Preserve Analytical Intent Across Layout Changes
Teams migrating from Tableau to Looker often worry about losing dashboard flow. Layout changes do not impact core narrative. Place key KPIs and charts in prominent tiles. Use text tiles and labels to guide users through the data story.
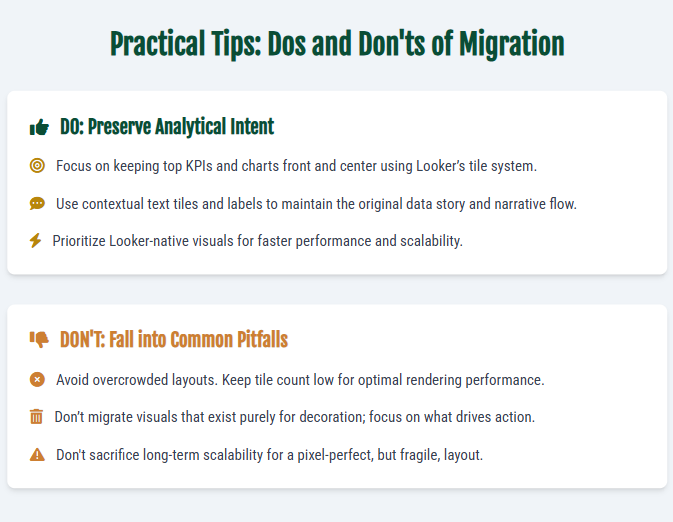
Use Looker-native visuals to optimize performance. Deploy custom plugins for complex visuals to match Tableau functionality. This approach maintains load times and scaling capability while delivering consistent insights.
Mitigate Migration Risks: Redesigning Tableau Dashboards in Looker
Migrations often fail due to dense layouts and poor performance. Over-stylized visuals rarely transfer to Looker. We reduce tile count to maintain high performance during recreation.
Remove decorative visuals. Retain elements that provide actionable insights. Design for scalability. Dashboards must perform well today and as datasets grow.
Why Redesigning Tableau Dashboards in Looker Improves Utility
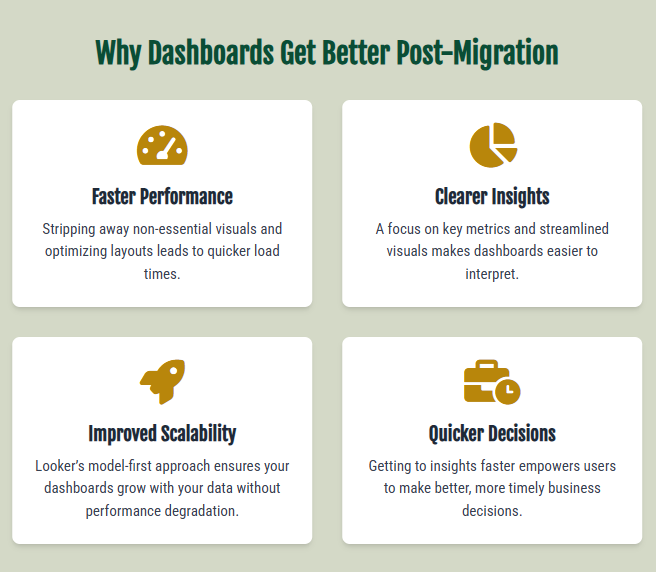
Recreating dashboards often yields stronger results than the original. We remove non-essential visuals and tighten layouts. This optimization improves load speed and interpretability. Users access insights faster. This supports quicker, better decisions.
Strategic Value in Tableau-to-Looker Migration
Treat the migration as a design opportunity, not just a conversion. This phase allows you to improve speed, clarity, and scalability. Our team translates complex Tableau visuals into streamlined Looker dashboards. We preserve your analytical intent while reducing visual noise and improving usability.
Request a consultation for your Tableau-to-Looker migration →
Related guides: the Tableau to Looker migration roadmap and common Tableau to Looker migration challenges.
No. Standard charts (bar, line, pie) transfer directly. Complex visuals (treemaps, radial charts) often require redesign. The goal is to preserve the analytical intent and data narrative, even if the layout changes.
Looker uses a governed approach. Tableau allows ad-hoc adjustments. Looker requires conditional filters and parameters to be defined in the LookML model before use. This structure ensures stability and consistency across the data platform.
Yes. The migration process removes non-essential visuals and optimizes data structures. This reduces layout complexity and improves load performance. Teams gain faster access to reliable data, which supports confident decision-making.
Looker defines behavior in LookML before exposing controls to users. Write conditional filters into the model to govern data subsets. Configure cross-chart filtering to update linked charts on click. Define parameter values during migration, and model set-based actions in LookML to maintain capability and stability.
Complex visuals, including treemaps and radial charts, require full reconstruction. Use this phase to remove redundant elements and retain only those that support decisions. Standard bar, line and pie charts migrate with minimal effort using Looker native visualization tools. Where native visuals are insufficient, use the Looker plugin framework.
No. Layout changes do not impact the core narrative. Place key KPIs and charts in prominent tiles, and use text tiles and labels to guide users through the data story. Use Looker-native visuals to optimize performance, and deploy custom plugins for complex visuals to match Tableau functionality.
We perform a rigorous validation phase. We run side-by-side comparisons to confirm every KPI matches the source. We then conduct user acceptance testing with business teams. This process verifies functionality and builds trust in the new environment.