
Table of Contents
Reasons Organizations Migrate from Tableau to Looker
Tableau to Looker Migration Roadmap
Addressing Key Migration Challenges With Accelerators
Squareshift Migration Capabilities
Action Plan
- Phase 1: Discovery and Strategy
- Phase 2: Looker Environment Setup
- Phase 3: Validation and User Adoption
- Phase 4: Optimization and Growth
Factors Driving the Migration from Tableau to Looker
Tableau supports rapid data exploration through drag-and-drop interfaces and visual analytics. It enables teams to test hypotheses and present findings efficiently. As organizations scale, however, challenges emerge. These include:
- Maintaining multiple dashboards.
- Managing inconsistent calculations.
- Scaling analytics securely across departments.
Looker addresses these challenges through a semantic layer and LookML modeling. Key capabilities include:
- Standardizing metrics across the business.
- Enabling reusable data models.
- Integrating with cloud data warehouses such as BigQuery, Snowflake, and Redshift.
These features provide greater governance and scalability than workbook-based environments.
A Tableau to Looker migration is a platform change. It is also a chance to build analytics infrastructure that scales with business needs. Align your BI platform with your long-term data strategy. Support embedded analytics, automated governance, and a single source of truth.
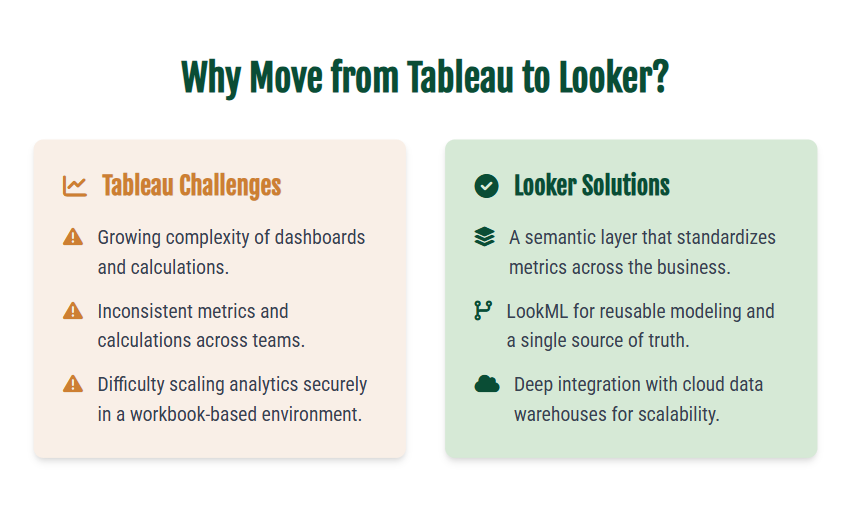
Tableau to Looker Migration Roadmap
Successful migrations use a proven framework. We divide the process into four phases. Each phase reduces disruption. Each phase maximizes day-one value.
Phase 1: Discovery and Strategic Planning
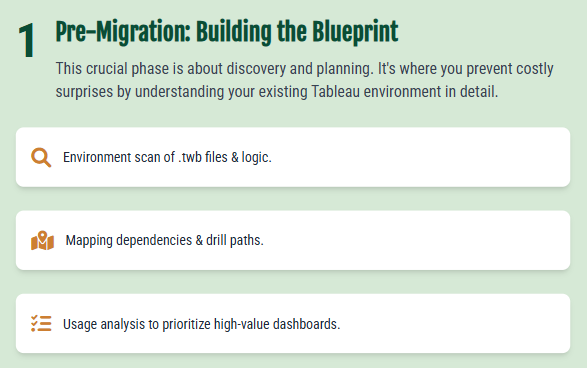
Start every migration by defining current assets. Many teams underestimate the complexity in their Tableau environment. This complexity includes scattered calculations, embedded logic, and hidden dependencies.
Discovery Activities
We scan your Tableau environment to map chart types, calculated fields, filters, parameters, and data relationships. This inventory defines migration scope and identifies optimization opportunities.
Usage patterns indicate which dashboards drive the most business value. We prioritize high-impact reports for early Looker migration to deliver immediate results.
We identify features that differ between platforms. Level of Detail expressions and custom visualizations may require alternative Looker implementations. We plan these changes before migration begins.
Phase Success Metrics
- Complete inventory of dashboards, workbooks, and data sources
- Usage analytics identifying reports that drive business decisions
- Migration priority list based on business impact
- Technical complexity assessment for timeline planning
Phase 2: Build the Looker Environment
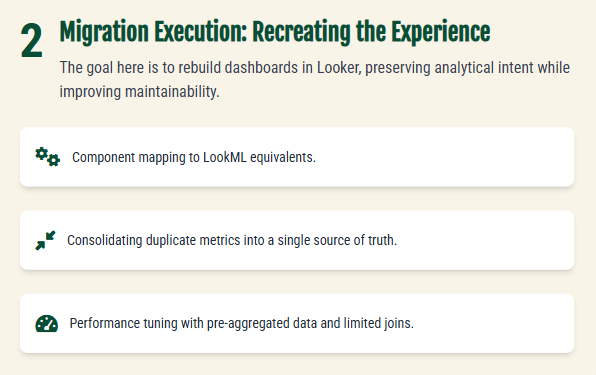
We rebuild the Tableau environment in Looker. This process improves maintainability and scalability.
Component-by-component migration:
Map every Tableau measure, dimension, and filter to the corresponding LookML object. Translate business logic into the structured LookML framework. Do not perform a direct copy-paste operation.
Consolidate duplicate metric definitions into single, governed measures. This eliminates conflicting revenue values across sales and executive reports.
Visualization strategy:
- Standard charts (bars, lines, tables) map directly to Looker native features. These charts often run faster.
- Complex visualizations use Looker Marketplace extensions or custom code. This matches specific user needs.
Performance optimization
- Structure Looker Explores to reduce load times.
- Use pre-aggregated tables for large data sets.
- Optimize joins at the modeling layer.
- Dashboards run faster. Analytical depth remains the same.
- Client profile: Retail firm.
- Starting state: 150 Tableau dashboards. Each calculated “customer lifetime value” (CLV) differently.
- Migration action: Create one LookML measure. This measure drives all CLV calculations.
- Result: Numbers align across the organization. Teams trust consistent insights.
See how we rebuild Tableau dashboards in Looker. This process preserves analytical intent and increases speed.
Phase 3: Validate Data and Drive User Adoption
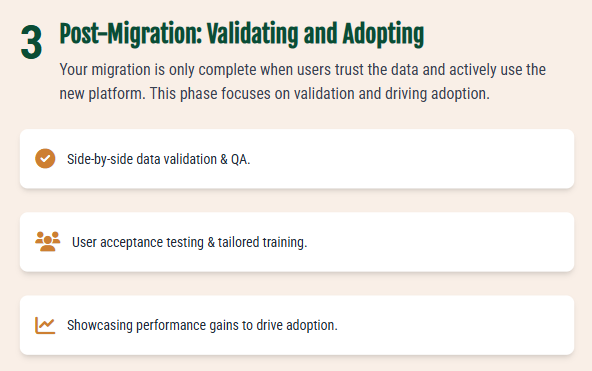
Measure migration success by user adoption and trust, not technical completion.
Verify Data Accuracy
Compare original Tableau dashboards with new Looker versions side-by-side. Validate that all KPIs match. Identify edge cases. Ensure business continuity.
Business teams perform user acceptance testing, not just IT. Walk through real workflows. Verify that daily operations run smoothly in the new environment.
Adoption strategy:
Demonstrate immediate value. Users respond to faster load times, simplified interfaces, and consistent metrics.
Provide role-based training. Executives and analysts require different skills. This method accelerates productivity for all users.
Communicate early wins in business terms. Highlight reduced reconciliation time, faster insight access, and increased confidence in data decisions.
Review our data integrity documentation for validation standards. Request a sample validation report to see specific test results.
Phase 4: Optimize Performance and Scale Usage
A completed migration establishes a stable analytics environment. Post-launch focus shifts to sustaining data accuracy and expanding system capabilities.
Sustain data integrity:
Run regular validation checks against source data to maintain metric accuracy. Automated monitoring detects errors before they impact business decisions.
Apply ongoing governance to ensure new reports meet established standards. This prevents metric proliferation, a common driver for migration projects.
Expanded capabilities
Teams with LookML expertise build advanced analyses that were impractical in Tableau. The modeling layer enables reuse of complex business logic across reports.
Integration with other Google Cloud Platform services supports advanced analytics as requirements change.
Common migration challenges and resolution strategies
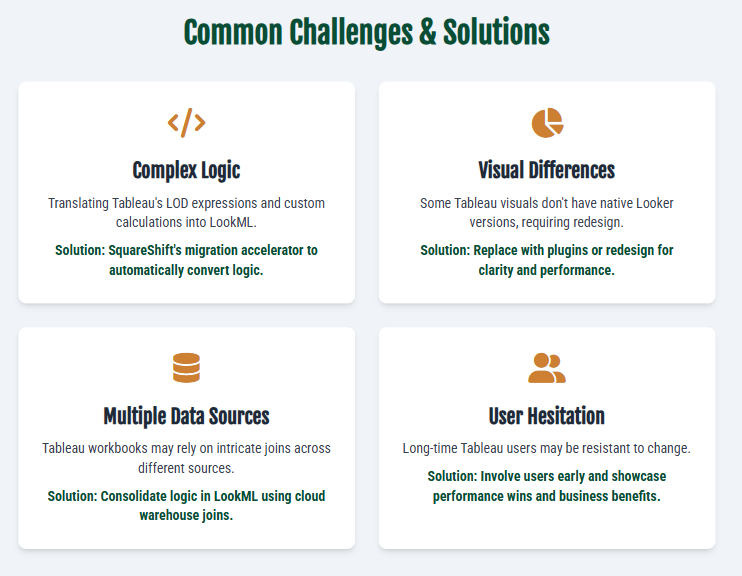
Complex calculation logic: Tableau Level of Detail expressions and nested calculations require careful translation.
The Migration Accelerator detects complex calculations. It converts them to optimized LookML measures. This preserves business logic and improves performance.
Visualization gaps exist between platforms. The accelerator identifies these gaps during assessment. It provides a library of proven alternatives.
Tableau workbooks often blend data from multiple sources. The Assessment Accelerator maps these dependencies. The Migration Accelerator consolidates this logic into clean LookML models. This improves maintainability and performance.
SquareShift: Expert Tableau to Looker Migration
As a Google Premier Partner and authorized Looker reseller, we master both platforms. We guide organizations through complex data transformations. We focus on business outcomes, not just technical execution.
The migration approach includes:
Assessment: Analyze the current Tableau environment. The process includes automated workbook parsing and usage pattern analysis.
Migration: Translate Tableau logic into structured LookML models. These models improve performance and support scalable expansion.
Quality assurance: Test all dashboards rigorously. Confirm correct function before team deployment.
This process manages technical complexity. This allows you to focus on applying analytics for business growth.
Next Steps
A Tableau to Looker migration exceeds a platform swap. It builds scalable, governed analytics to support long-term organizational growth.
A qualified migration partner ensures a successful transition. Our structured approach and dual-platform expertise maximize value from day one.
Discuss how Looker can strengthen your analytics. We address your governance and scalability challenges to align with your business goals.
Contact an Expert
Frequently asked questions
What are the phases of a Tableau to Looker migration roadmap?
What happens to Tableau Level of Detail expressions in Looker?
How do you check that Looker dashboards match Tableau?
Businesses migrate from Tableau to Looker to improve scalability and governance. Looker’s semantic layer and LookML standardize metrics. This creates a single source of truth. Tableau’s workbook structure makes this difficult. Complex calculations, visualization gaps, and multiple data sources present common challenges. SquareShift accelerators and expertise automate logic conversion and consolidate data sources. A successful migration provides a scalable analytics platform with strong data governance. This results in faster dashboards and consistent metrics. It enables confident data usage for business growth. This extends beyond a simple platform switch. SquareShift is a Google Premier Partner and authorized Looker reseller. We have deep expertise in both platforms. We can convert all Tableau dashboards to Looker. Our process scans the Tableau environment to map chart types, calculated fields, and data relationships. Standard visualizations translate directly. We provide solutions for complex or unique visualizations.