
Mechanism and Differentiation
The SquareShift Tableau to Looker migration accelerator reads Tableau TWB files, maps charts and calculations to LookML, and flags exceptions for your team to review. Businesses move from Tableau to Looker as they outgrow workbook-based analytics. Tableau supports visual exploration. However, maintaining consistent definitions and governing dashboards at scale becomes difficult.
Migration from Tableau to Looker changes enterprise BI strategy. This shift does not diminish Tableau. It reflects evolved enterprise BI requirements. The focus moves from ad-hoc visualization to centralized governance, reusable semantic layers, and scalable embedded analytics.
View the process
Differences in Tableau and Looker Architecture
Tableau supports interactive, visual data exploration. Users drag and drop data fields to build dashboards. This method aids discovery but often results in fragmented logic and inconsistent metric definitions across teams.
Looker uses a semantic layer with LookML. This defines data relationships and business logic once. The system applies these definitions everywhere. This ensures uniform metrics across dashboards and supports scalability.
Example:
- Tableau Level of Detail (LOD) expressions create custom aggregations independent of chart filters.
- In Looker, these expressions become reusable LookML measures. They function across dashboards without redefinition.
The accelerator moves logic from individual dashboards to a central, governed model.
SquareShift Looker Migration Accelerator: Value and Scope
The accelerator converts Tableau visual logic into scalable LookML dashboards.
It performs two core functions:
- Assess chart intent.
- Map intent to Looker capabilities.
This process ensures structural alignment, not just visual replication.
- Analyze Before Conversion
The tool reads Tableau TWB files. It detects chart types, calculated fields, and data sources. It flags repeated patterns. If five workbooks define “Customer Lifetime Value” differently, it recommends a single governed definition. 2. Chart Mapping Logic
The Accelerator includes a visualization remapper for Looker. This maps Tableau visuals to Looker-native or plugin-based equivalents.
Examples include:
- Treemaps and bar charts map directly to Looker.
- Bump charts and Sankey diagrams use Looker marketplace visualizations or plugins to retain analytical intent.
For dual-axis charts, the tool generates structured LookML to reflect the logic. This preserves analytical value, even when visual style changes.
Preview the Accelerator
Process Flow and Key Features of the Tableau to Looker Migration Accelerator
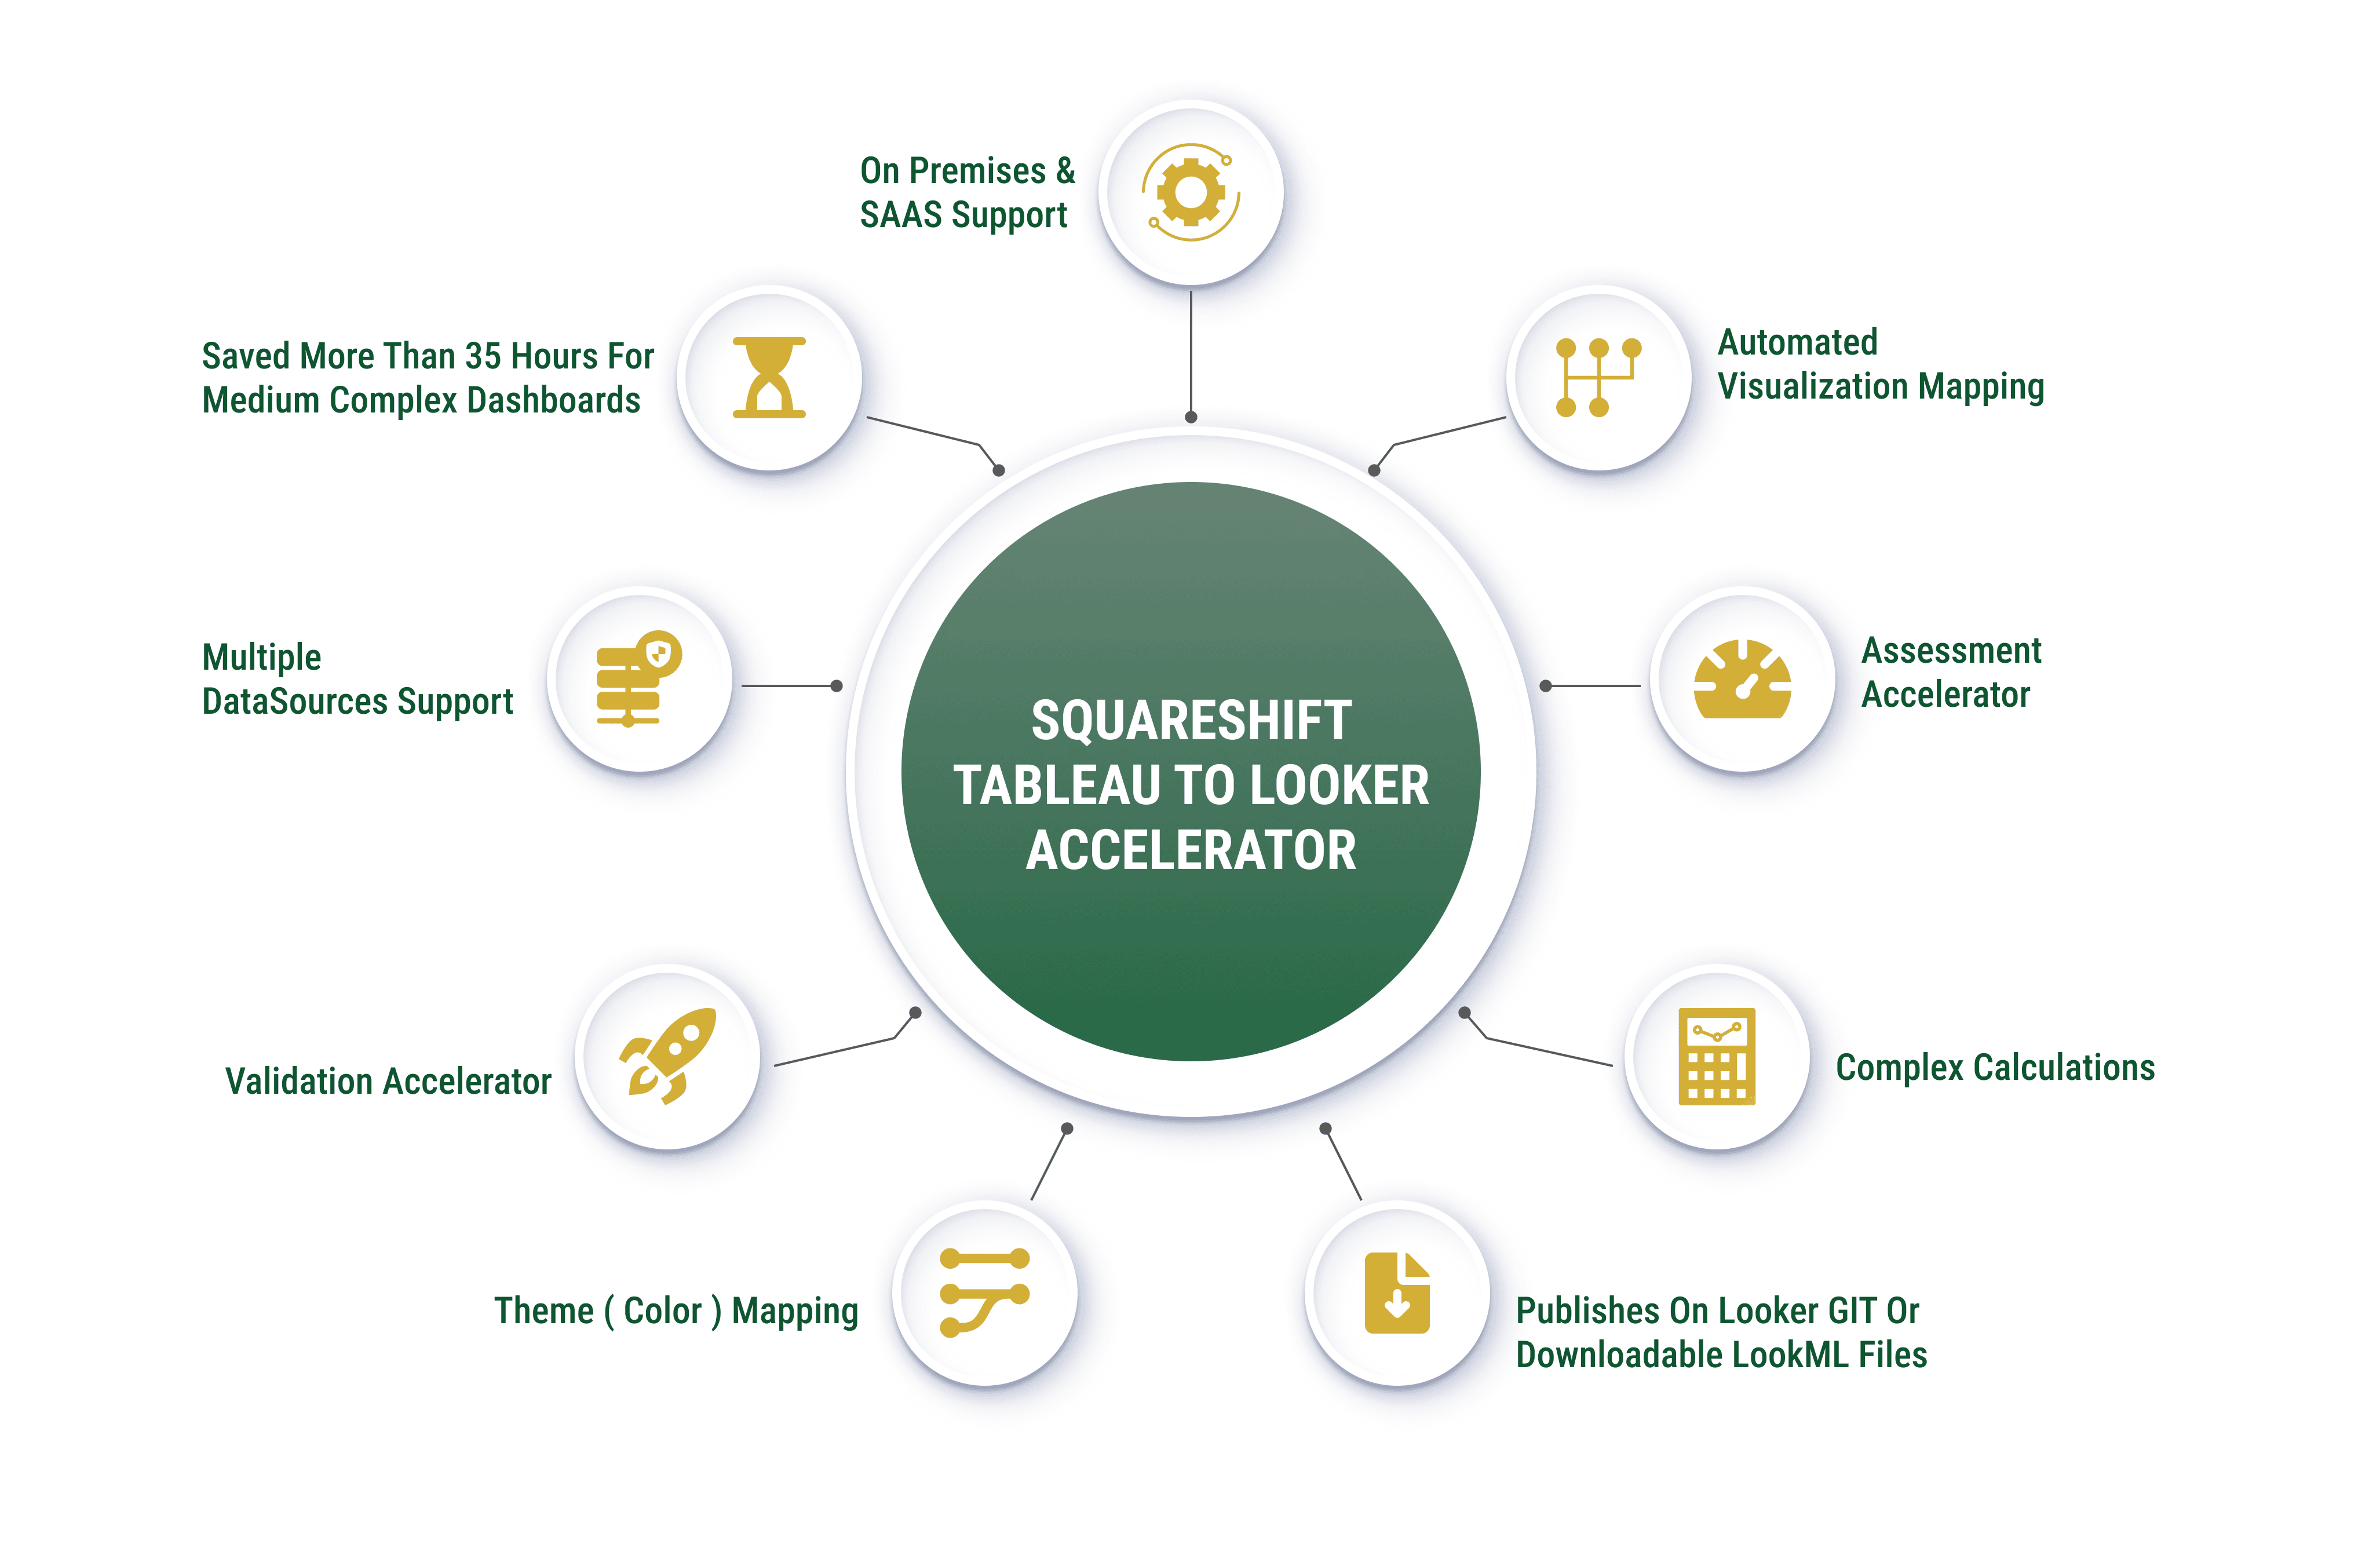
The Accelerator uses a structured process to migrate Tableau (TWB) files to Looker dashboards, views, and models. The tool runs on Google Cloud Platform to ensure scalability and security. Key features include:
- Parse Tableau workbooks automatically.
- Identify visualization types and data sources.
- Map dependencies across dashboards.
- Core Visualization Re-mapper component
- Recognize and consolidate patterns in similar calculated fields and dashboards.
These features reduce manual effort. They speed migration. They provide visibility into the BI ecosystem.
Download the Migration Blueprint
Process for Complex Tableau Features
Some Tableau features require extra care. These features use flexible or ad hoc calculations.
The Accelerator processes these items:
- LOD expressions. The tool converts these into semantic-layer logic. It uses views or pre-aggregated tables.
- Calculated fields. The tool converts these into governed LookML dimensions or measures.
- Dual-axis visuals. The tool separates series. It assigns them within LookML.
If the tool cannot convert an object automatically, it flags it. Your team reviews these cases. You focus effort only where human judgment is required.
Design a Scalable BI Architecture on Looker
The migration updates business intelligence capabilities with Looker. It does not only migrate current dashboards.
The tool generates LookML code that follows clean, optimized patterns. This ensures efficient and reliable data models. The code includes:
- Accurate aggregation logic: Calculations remain accurate and consistent.
- Correct data typing: Data types match requirements for optimal performance.
- Logical model structure: Models organize data for clarity and scalability.
The tool supports embedded analytics via the Looker API, iFrame, and Extension Framework. Embed dashboards directly into customer portals or internal tools.
Scalable Migration Strategy
Organizations use phased migration strategies. The Looker migration tool supports this approach by:
- Identifying high-impact dashboards for initial migration. Prioritize critical assets.
- Automating 60–80% of the workload. Reduce manual effort and accelerate the transition.
- Integrated QA tools support iterative validation. This enables thorough testing and refinement in each phase.
The process saves weeks of work. Analysts focus on optimization, not rework.
Long-Term Benefits of the Migration Accelerator
Post-migration, organizations report key long-term benefits, including:
- Increased data trust across departments
- Streamlined onboarding of new dashboards
- Reduced time spent fixing broken logic or outdated charts
Teams gain lower infrastructure requirements and maintenance costs. Looker embedded analytics enables a shift from isolated reports to integrated workflows.
Automating repetitive migration tasks frees time for creative work. Staff can move from maintenance to data modeling and new use case development.
Related guides: the Tableau to Looker migration roadmap and data integrity in Tableau to Looker migration.
If you maintain Tableau dashboards and plan to migrate, act now. This accelerator combines AI automation with expert review to ensure fast, precise results.
Plan Your Tableau to Looker Migration with SquareShift
Frequently Asked Questions
What is Tableau to Looker migration?
It is the process of moving dashboards, visualizations, and logic from Tableau to Looker. This is critical for maintaining data accuracy, reducing redundancy, and enabling a scalable, long-term business intelligence strategy. Looker provides a centralized semantic layer with consistent metric definitions and robust governance.
How does the SquareShift Accelerator simplify this migration?
The accelerator automates the process. It scans Tableau workbooks, identifies charts and calculations, and maps them to Looker-native dashboards or plugins. It converts complex features, such as Level of Detail (LOD) expressions, into reusable LookML measures. The tool flags exceptions for manual review. It reduces manual effort by up to 80%, making migration faster and less error-prone.
Which Tableau complexities does the accelerator handle?
It converts LOD expressions, separates dual-axis visuals, and translates calculated fields into governed LookML dimensions and measures.
What are the key benefits?
The accelerator provides speed and precision. It automates 60–80% of the manual workload, saving weeks of time. Teams can focus on strategic tasks, such as optimization and new use cases. It ensures generated LookML is clean, performance-optimized, and scalable.
Can complex Tableau dashboards migrate to Looker without losing analytical intent?
Yes. The accelerator preserves analytical intent. It translates calculations and visual logic into LookML. Dual-axis charts, custom aggregations, and advanced calculations are restructured for the Looker semantic layer. Dashboards remain accurate and functional. This supports scalable, governed analytics for the entire organization.
What long-term benefits do organizations gain?
Migration improves data trust and standardizes metrics. It simplifies dashboard maintenance. Teams spend less time fixing broken logic. They onboard new dashboards faster and focus on modeling or innovation. Embedded analytics supports integration with internal tools and customer portals, delivering scalable insights.
How does SquareShift accelerate BI migration?
SquareShift provides an AI-powered migration accelerator. It automates 60–80% of the migration process. It scans workbooks, identifies visualizations and calculations, maps them to Looker dashboards, and flags exceptions for review. This reduces manual effort, ensures consistent metrics, and maintains analytical accuracy.
Why choose SquareShift for BI migration projects?
SquareShift combines automated migration with expert oversight. The accelerator preserves analytical intent and converts complex features into reusable LookML logic. It supports embedded analytics. It reduces rework, improves governance, and enables scalable BI models. SquareShift helps organizations modernize their analytics stack efficiently and relia
How much of a Tableau migration does the accelerator automate?
The accelerator automates 60-80% of the workload. This reduces manual effort and saves weeks of work. Integrated QA tools support iterative validation in each phase. It identifies high-impact dashboards for initial migration, and it flags any object it cannot convert automatically so your team reviews only those cases.
What Tableau files does the migration accelerator read?
The accelerator reads Tableau TWB files. It detects chart types, calculated fields and data sources, and it maps dependencies across dashboards. It then migrates them to Looker dashboards, views and models. The tool runs on Google Cloud Platform to ensure scalability and security.
Can I embed the dashboards the accelerator builds?
The tool supports embedded analytics via the Looker API, iFrame and Extension Framework. You can embed dashboards directly into customer portals or internal tools. The LookML code it generates follows clean, optimized patterns, with accurate aggregation logic, correct data typing and a logical model structure.