
Table of Contents
Looker Performance Optimization and Challenges
Reduce Data Model Load
Optimize Query Execution
3.1 Reduce Calculation Complexity
3.2 Refresh Data on Demand
3.3 Limit Exploration Data Volume
3.4 Deploy Pre-Aggregated Data
Configure Platform Usage Settings
4.1 Manage Caching Strategy
4.2 Control User Access
4.3 Streamline Dashboard Structure
4.4 Schedule Reports During Low-Usage Periods
4.5 Monitor Explore and Dashboard Performance
Establish Performance Benchmarks and Monitoring
Conclusion
- 2.1 Limit Data Joins
- 2.2 Avoid Temporary Tables Where Feasible
- 2.3 Limit Scope of Explores
- 2.4 Apply Drill Fields Only When Necessary
- 2.5 Simplify Access Control Logic
- 2.4 Reuse Existing Business Logic
1. Looker Performance Optimization: Context and Challenges
Looker performance optimization works in three steps: reduce the data model load, improve query performance, and adjust platform usage settings. Successful optimization typically yields a 60-80% reduction in dashboard load times and query response times that improve from minutes to seconds.
Looker is a business intelligence platform that connects directly to your database to provide real-time analytics and visualization. It generates SQL queries dynamically. This design supports large-scale analysis. It also requires precise performance optimization. Traditional BI tools often extract data before analysis. Looker does not extract data.
Data volume increases cause common symptoms. These symptoms include report delays, longer load times, and inconsistent performance. These signs indicate that the setup requires attention.
This guide outlines steps to improve Looker performance on large datasets. It covers data model optimization. It covers platform usage best practices.
2. Reduce Data Model Load
Performance improvement starts with the data structure and exposure in Looker. A lean model keeps queries fast. It keeps queries manageable. This applies to datasets with hundreds of millions of records.
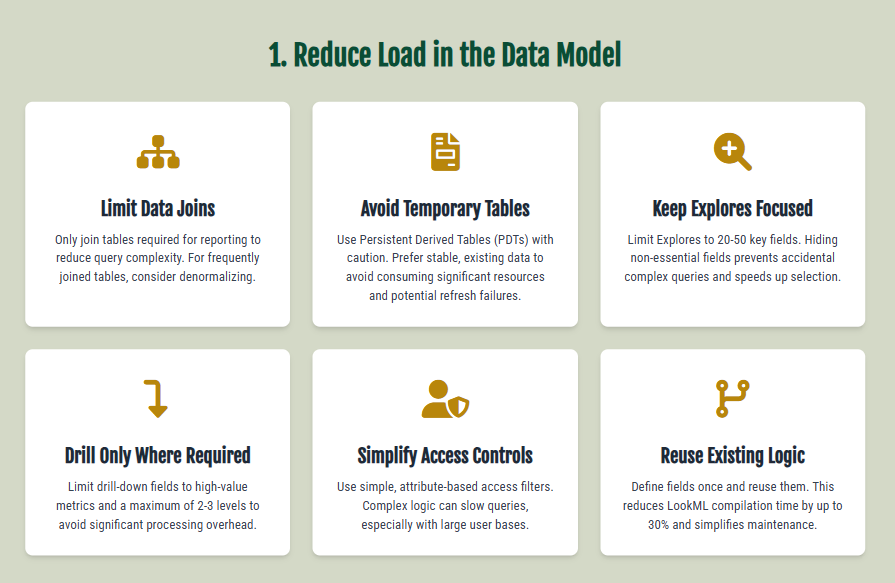
2.1 Restrict Data Joins
- Include only tables required for the report.
- Each additional join increases query complexity and execution time.
- Omit unnecessary joins.
- Add forced joins only when business logic requires them.
- Denormalize frequently joined tables to reduce real-time query load.
2.2 Minimize Use of Persistent Derived Tables
- Use Persistent Derived Tables (PDTs) with caution.
- PDTs consume significant system resources.
- PDT builds for large datasets take 15 to 45 minutes.
- Failed PDT refreshes can cause dashboard failures.
- Use existing stable data when available.
- Reduce PDT dependencies to improve system stability.
2.3 Define Explore Scope
Restrict the number of fields in each Explore.
- Studies show that Explores with over 100 fields delay query selection by 3–5 seconds.
- Display only relevant dimensions and measures.
- Target 20–50 key fields per Explore.
- Hide non-essential fields to prevent accidental selection and complex queries.
Use Drill Fields Only Where Required
Drill-down fields increase complexity and impact optimization.
- Add drill fields only where users need additional details.
- Benchmarks show each drill field adds 10–15% to query processing time.
- Limit drill capabilities to high-value business metrics.
- Maintain drill structures to a maximum of 2–3 levels.
Simplify Access Controls
Avoid complex logic for user-level access control.
- Complex access filters slow queries, especially for large user bases.
- Use simple filters based on attributes or predefined roles.
- Avoid intricate conditional logic.
- Implement access controls at the database level when possible for better performance.
2.6 Reuse Existing Logic
- Define fields once. Reuse dimensions and measures across views.
- Maintain model consistency.
- Reduce LookML compilation time by 20% to 30%.
- Simplify maintenance.
- Improve query plan optimization across the implementation.
3. Improve Query Performance
Optimize queries after model optimization.
- Reduce wait times.
- Improve user experience.
- Reduce query times from minutes to seconds.
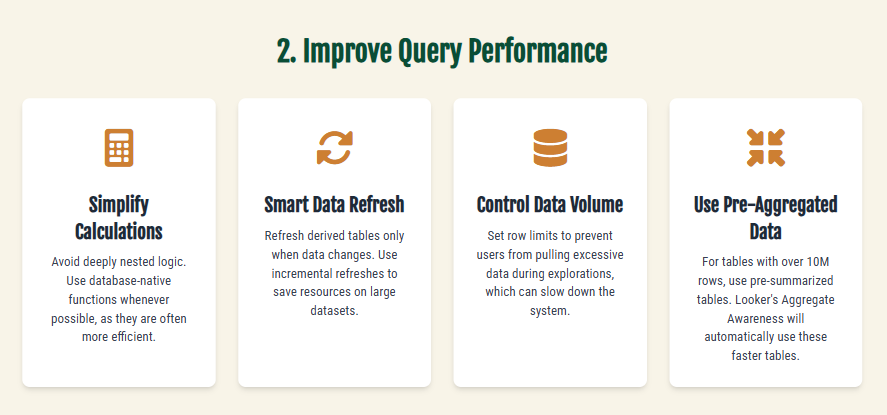
3.1 Simplify Calculations
Limit nested logic in calculated fields.
- Reduce conditional statements.
- Keep nesting below five levels.
- Use database-native functions where possible.
These practices improve query performance on large datasets.
3.2 Refresh Data Only When Necessary
Minimize unnecessary derived table refreshes.
- Use trigger conditions based on data changes.
- Replace arbitrary time schedules with custom logic.
- Implement incremental refreshes for large datasets.
These steps reduce system resource consumption.
3.3 Control Data Volume in Explorations
Set row limits to manage query size.
- Default limit: 500 rows.
- Detailed analysis: 1,000 to 5,000 rows.
- Data exports: 10,000+ rows.
Enable automatic cancellation for long-running queries. This prevents system resource exhaustion.
3.4 Implement Pre-Aggregated Data
For datasets exceeding 10 million rows, use pre-summarized tables instead of recalculating values for each user query.
- Aggregate tables improve query performance by 10 to 100 times.
- Looker aggregate awareness redirects queries to these tables when conditions are met.
- Monthly and weekly summary tables run 95% faster than row-level calculations.
This approach provides significant performance gains for routine reporting.
4. Optimize Platform Usage Settings
Daily usage patterns affect system performance. Adjusting these patterns and platform settings reduces unnecessary load by 30-50%. This change also improves the overall user experience.
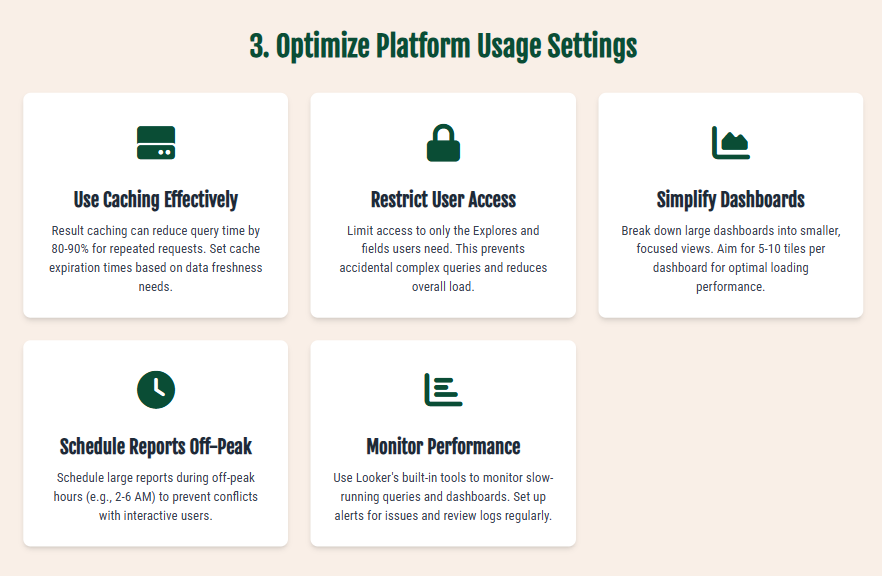
4.1 Use Caching Effectively
Enable result and PDT caching to improve performance. Result caching cuts query time by 80-90% for repeated requests. Combine this with aggregate tables to limit re-calculations. Set expiration times between 1 and 24 hours based on data freshness needs.
4.2 Restrict User Access
Grant access only to required Explores and fields. Role-based access controls limit query load by 20-40%. Apply controls for viewers, analysts, and administrators. Use content access to restrict dashboard visibility based on data sensitivity.
4.3 Simplify Dashboards
Limit tiles, filters, and visual elements to maintain load speed. Dashboards with more than 15 tiles often take 60+ seconds to load. Excess complexity degrades system performance. Split large dashboards into views of 5-10 tiles. Apply dashboard-level filters to reduce query complexity.
4.4 Schedule Reports During Off-Peak Windows
- Avoid scheduling frequent reports during business hours.
- Interactive users require real-time access to dashboards and explores.
- Schedule reports during off-peak windows, typically 02:00–06:00 local time.
- This prevents resource conflicts with interactive users.
- Distribute large report schedules across distinct time slots.
- Do not cluster schedules in a single window.
- Use incremental data loads where possible.
- Incremental loads reduce system impact compared to full refreshes.
4.5 Monitor Explore and Dashboard Performance
- Use Looker’s built-in monitoring tools.
- Identify Explores and dashboards with load times exceeding 10–15 seconds.
- Review logs regularly to detect performance issues.
- Address problems before they impact users.
- Configure automated alerts for queries that exceed performance thresholds.
- Establish regular review processes to maintain system performance.
5. Looker Performance Benchmarks and Monitoring
Benchmarks measure optimization success and define improvement targets.
- Simple queries (1-2 tables): < 5 seconds.
- Medium queries (3-5 tables): 5-15 seconds.
- Complex queries (5+ tables): 15-30 seconds.
- Dashboard loads: < 10 seconds for 80% of use cases.
System resource benchmarks guide optimization targets.
- PDT refresh: < 30 minutes for tables with 50M+ rows.
- Concurrency: 50-100 users without degradation.
- Memory usage: < 80% during peak times.
- Query success: > 95% without timeouts.
User experience metrics validate optimization results.
- Dashboard adoption: > 70% among intended users.
- Query abandonment: < 10%.
- User satisfaction: 4+ / 5 for responsiveness.
Monitor performance continuously.
- Weekly reviews:
- Analyze and optimize slow queries.
- Review PDT performance and refresh schedules.
- Check system resource utilization trends.
- Update user access permissions based on usage patterns.
- Monthly audits:
- Review data model complexity.
- Assess dashboard usage patterns.
- Update aggregate tables based on query patterns.
- Benchmark performance against previous months.
Conclusion
Looker performance issues stem from model complexity, heavy queries, and inefficient usage. Teams reduce latency and improve reporting speed by reviewing these areas and applying the improvements listed above.
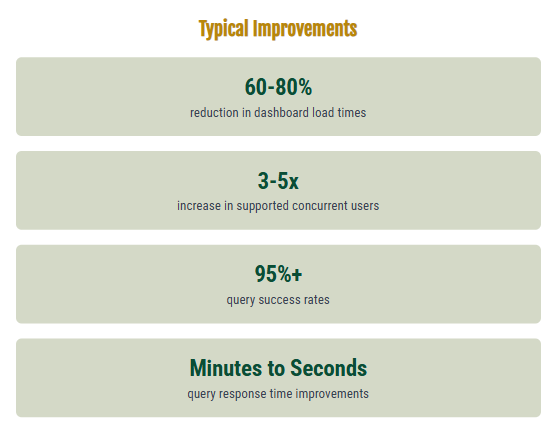
Successful optimization typically yields the following results:
- 60-80% reduction in dashboard load times
- Query response time improvement from minutes to seconds
- Support for 3-5 times more concurrent users
- 95%+ query success rates with large datasets
Effective optimization requires a systematic approach. Address data modeling, query optimization, and usage patterns simultaneously. Organizations that implement these strategies report consistent gains in user adoption and business intelligence effectiveness.
Related reading: Looker health checks for data-driven teams and how Looker brings scalable governance to marketing teams.
Reviewing Your Looker Setup?
Our Looker support consulting optimizes Looker performance without altering reporting structures. Our services include:
- Data model cleanup and restructuring for 50-80% performance gains
- Dashboard tuning and simplification to reduce load times
- Query optimization for complex analytical workloads
- Scaling analytics infrastructure for terabyte and petabyte datasets
Clients typically achieve 60-90% improvement in dashboard performance and 3-5 times higher user adoption rates within 30-60 days of implementation. Contact us for support with:
- Model cleanup
- Dashboard tuning
- Scaling analytics for large data volumes
We provide a customized optimization approach tailored to your data environment and user needs.
Optimize your Looker setup. Contact us for a customized approach tailored to your data environment and user needs.
Frequently Asked Questions
Q: How do I make Looker queries run faster?
- Simplify LookML calculations.
- Use aggregate tables with Looker’s aggregate awareness.
- Apply filters or row limits to reduce data load.
Q: How do I optimize dashboards for better performance?
- Simplify dashboards to reduce load times.
- Limit dashboards to 5-10 tiles.
- Break large, complex views into smaller, focused dashboards.
Q: How do I monitor Looker performance?
- Use Looker’s System Activity dashboards to identify slow queries and poor-performing content.
- Review logs proactively to catch issues before they affect users.
- Set alerts for queries that exceed performance thresholds.
Q: Can Looker handle large amounts of data?
Yes. Looker supports petabyte-scale datasets. With the correct cloud warehouse configuration, it delivers fast, efficient queries at scale. SquareShift ensures the configuration optimizes performance.
Q: What distinguishes SquareShift from other Looker consultants?
- We reject one-size-fits-all solutions.
- We tailor optimization to your specific data environment and user needs.
- We provide deep technical support for model cleanup, dashboard tuning, and organization-wide analytics scaling.
Q: How long do PDT builds take in Looker?
PDT builds for large datasets take 15 to 45 minutes. PDTs consume significant system resources, and failed PDT refreshes can cause dashboard failures. Use them with caution and use existing stable data when available. A benchmark target is a PDT refresh under 30 minutes for tables with 50M+ rows.
Q: How many tiles should a Looker dashboard have?
Limit dashboards to 5-10 tiles. Dashboards with more than 15 tiles often take 60+ seconds to load. Split large dashboards into views of 5-10 tiles and apply dashboard-level filters to reduce query complexity. A benchmark target is a dashboard load under 10 seconds for 80% of use cases.
Q: What is a good load time for Looker queries?
Benchmarks for query time: simple queries (1-2 tables) under 5 seconds, medium queries (3-5 tables) 5-15 seconds, and complex queries (5+ tables) 15-30 seconds. Dashboard loads should take under 10 seconds for 80% of use cases. Review Explores and dashboards with load times above 10-15 seconds.
Q: Does caching make Looker faster?
Yes. Enable result and PDT caching to improve performance. Result caching cuts query time by 80-90% for repeated requests. Combine it with aggregate tables to limit re-calculations. Set expiration times between 1 and 24 hours, based on how fresh the data must be.