
Organizations modernizing business intelligence platforms must focus on execution strategy rather than migration decision.
Transitioning from Tableau or Power BI to Looker requires more than replicating dashboards. It requires safeguarding business knowledge, validating accuracy, and preparing users for a new analytical model.
The following steps outline a methodical approach to migration. These patterns are based on large-scale projects.
Pre-Migration Validation
Late-discovered foundational issues cause most migration delays. Validate the current environment before migrating dashboards.
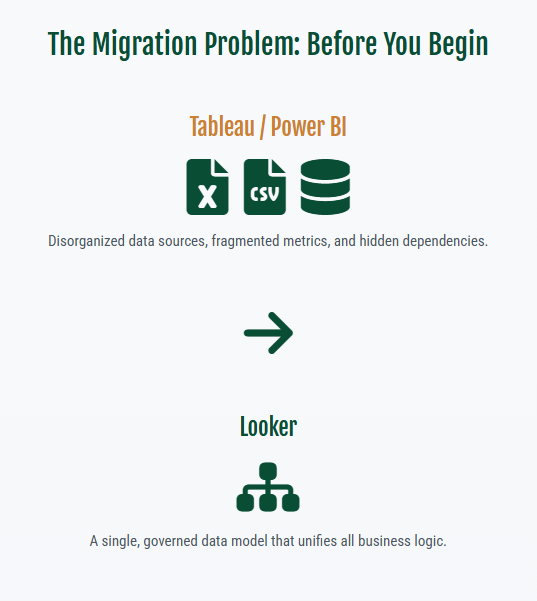
- Hidden extracts and caches. Tableau often uses local extracts. Power BI relies on cached datasets. These data copies drift from the central warehouse over time.
- Blended data sources. Reports combine multiple sources. Joins are often undocumented. You cannot replicate these structures directly.
- Irregular refresh cycles. Data pipelines update at different times. Dashboards display mismatched results.
The SquareShift Assessment Accelerator catalogs these dependencies automatically. It scans existing environments. It identifies non-warehouse sources. It maps refresh schedules. This process defines the true scope of work and prevents early errors.
Read more about: Ensuring Data Accuracy and Integrity in Tableau to Looker Migration
Preserving Business Logic
Dashboards are not the primary challenge. Business rules within them are. Tableau level-of-detail expressions and Power BI DAX measures often contain undocumented definitions. Over time, teams create multiple variations of the same metric. These variations cause inconsistency.
Migration without this review risks loss of critical knowledge.
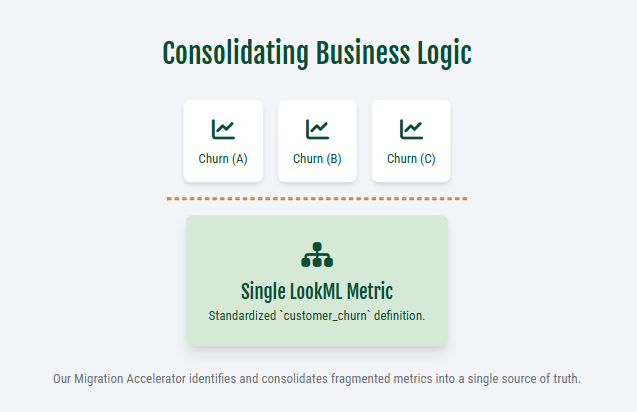
SquareShift’s Migration Accelerator identifies duplicate calculations across dashboards. It consolidates them into governed LookML measures. For example, five different definitions of customer churn can become a single reusable metric. This preserves institutional knowledge and reduces fragmentation.
Rebuilding in LookML
LookML structures metric definition and reuse. It introduces differences that require attention.
- Configure relative dates explicitly. Tableau defaults can shift results.
- Nested aggregations may require derived tables. Use aggregate-aware strategies.
- Filter and parameter behavior differs. Redefine these carefully.
SquareShift validates at the View and Explore levels. Automated queries compare LookML outputs to Tableau or Power BI equivalents. This confirms definitions align before dashboard construction. This reduces the risk of late-stage discrepancies.
Recreating Dashboards in Looker from Tableau and Power BI
Users focus on dashboards. These assets offer the greatest opportunity for efficiency. Many environments contain unused or duplicate dashboards. Rebuilding all items creates low value.
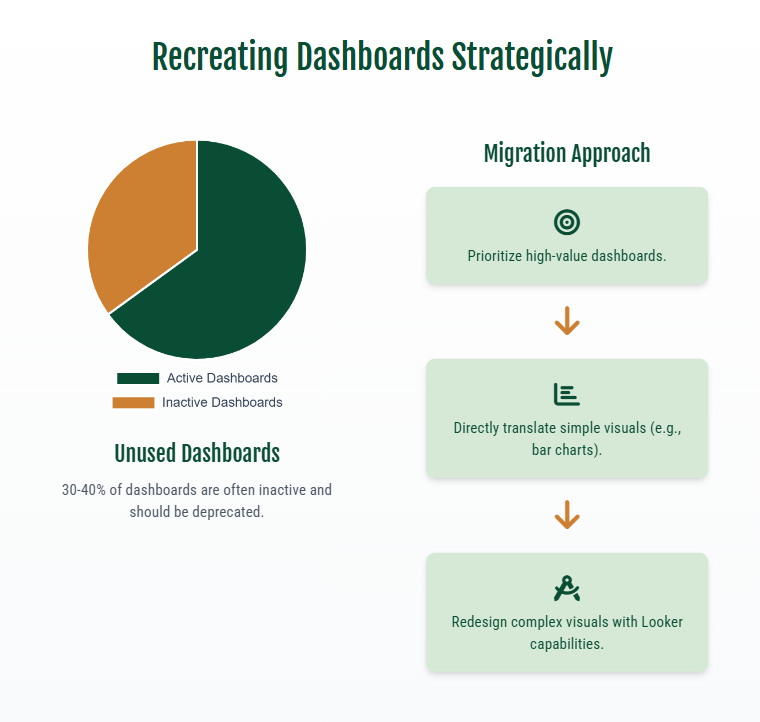
Migration data shows 30 to 40 percent of dashboards are inactive. Teams still maintain these assets.
The Assessment Accelerator identifies high-value dashboards for migration. It marks redundant dashboards for deprecation.
- Simple charts, such as bar or line graphs, require minimal effort to rebuild.
- Complex visuals, such as dual-axis charts or treemaps, require redesign or Looker plugins.
- Validate by comparing Tableau or Power BI dashboards with Looker versions. Check numeric accuracy and interactivity.
Read more about: Recreating Tableau Dashboards in Looker
Dashboard consolidation and stakeholder visibility issues appear at scale. One semiconductor client centralized siloed reports using Looker and BigQuery. Reporting time dropped 80%. Partners gained real-time visibility into training and sales performance.
Expected Challenges
Migrations face specific obstacles. Key items include:
- Logic translation gaps. Some Tableau sets and DAX formulas do not map to LookML. Our accelerators automate these or flag them for review.
- Visualization differences. Specialized charts, floating layouts, and custom formatting require redesign.
- Data source complexity. Multi-source dashboards must restructure into LookML explores using derived tables.
The SquareShift Assessment Accelerator identifies unsupported elements and generates complexity scores. This supports accurate resource and timeline planning.
Read more about: Common migration patterns from Tableau to Looker.
Reporting delays reduce user trust. Calculation errors do the same. An EdTech client faced this issue. Nightly batch processes left dashboards out of sync with live web activity. The team implemented a Looker architecture with serverless pipelines on GCP. Reporting became near real-time. Dashboards aligned with user activity. User confidence in analytics increased.
Securing Long-Term Value
Migration requires a sustainable operating model, not replication of legacy systems. LookML centralizes, version-controls, and makes metric definitions auditable. Workflows shift from workbook maintenance to collaborative development.
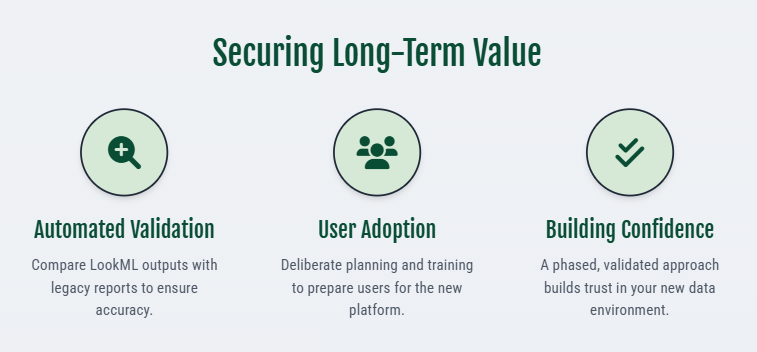
Organizations typically see: reduced maintenance overhead, fewer metric definition disputes, and faster report onboarding. Aligning analytics with cloud-native warehouses supports future scale.
SquareShift migration programs prioritize long-term value. Automating 70% to 80% of conversion tasks allows teams to focus on targeted redesign and growth planning.
Establishing Confidence in the Transition
Transitioning from Tableau or Power BI to Looker requires methodical preparation. Key steps include:
- Establish reliable data foundations.
- Capture and consolidate business logic.
- Validate models before dashboards.
- Prioritize high-value content.
- Support user adoption.
- Plan for known challenges.
SquareShift Assessment and Migration Accelerators provide automation, visibility, and validation frameworks. These tools reduce risk and shorten timelines. This approach ensures a successful migration and a stronger foundation for governed, scalable analytics.
Explore our full Tableau to Looker migration process for details on each stage.
Q: What is the main difference between Tableau/Power BI and Looker?
- Core Philosophy: Tableau and Power BI use workbook-based logic. This decentralizes data definitions. Looker uses a centralized, code-based semantic layer (LookML). This ensures a single source of truth for all reports and users.
Q: How do you handle Tableau’s Level of Detail (LOD) expressions or Power BI's DAX?
- Challenge: These formulas are complex and often undocumented.
- Solution: We use a proprietary Migration Accelerator. It identifies and translates these expressions into reusable LookML logic. This preserves and standardizes business rules.
Q: How does automation speed up a BI migration?
- Efficiency: SquareShift Assessment and Migration Accelerators reduce manual conversion workload by 70-80%.
- Impact: This accelerates the transition and minimizes human error.
- Focus: Your team shifts from repetitive conversion tasks to strategic work.
Q: How do your accelerators handle difficult, manual tasks?
- Identification: Accelerators automatically scan your environment. They identify complex dependencies and logic translation gaps.
- Review: They flag difficult cases for expert manual review.
Q: What are the benefits for non-technical business users?
- Reliability: The centralized semantic layer ensures consistent metrics. This eliminates data disputes.
- Accessibility: The front-end is clear and intuitive. Users can explore data and find answers without waiting for static reports.