
Conversational analytics changes data interaction. Users query data in natural language instead of navigating dashboards or verifying definitions. Answers align with business context. This method supports real-time decision-making.
Many BI platforms offer natural language interaction. The key differentiator is the reliability of business logic. Accuracy becomes critical when teams move from exploratory questions to revenue, operations, or customer decisions.
See our Complete Guide for Businesses on Conversational Analytics for a full adoption overview.
1. Comparison of top conversational analytics tools
Modern BI platforms use chat interfaces to reduce the effort required for data analysis. Each tool implements this function differently.
Tableau
Tableau emphasizes visual exploration. Its natural language features convert questions into charts. This function supports analysts and business users who explore trends. Tableau excels at visual storytelling and ad-hoc analysis. It serves environments where users test different data views.
Looker
Looker uses a governed semantic layer for conversational analytics.
- Answers use predefined business definitions.
- This ensures metric consistency across teams.
- This approach supports large organizations that require shared definitions and model reuse.
Domo
Domo combines conversational prompts with dashboards, alerts, and summaries.
- It surfaces current operational status.
- This supports operational awareness and rapid status checks.
Qlik
Qlik uses its associative engine to power conversational features.
- Users ask questions and trace relationships across data points.
- This supports discovery-oriented analysis of metric relationships across dimensions.
Microsoft Power BI
Power BI Q&A enables users to query data via text and generate visuals.
- The tool integrates with Microsoft Excel and Teams.
- It supports standard reporting requirements within Microsoft environments.
Splunk
Splunk applies conversational interfaces to machine data, logs, and events.
- Users query system behavior, usage patterns, and incidents.
- This function serves IT, security, and observability teams.
2. Looker Conversational Analytics: Key Features
2.1 Visualization Assistant: Generate charts from questions
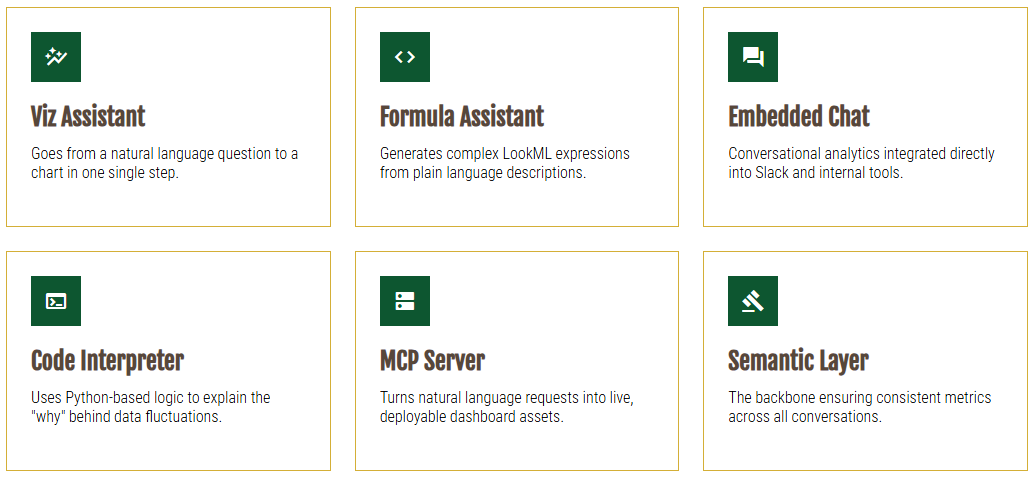
The Visualization Assistant supports rapid data retrieval. It requires no dashboard setup or analyst intervention.
Operational workflow
A revenue operations manager prepares for a leadership review. Ten minutes before the meeting, they query: “Pipeline value by region for the current quarter, sorted highest to lowest.”
Looker returns a bar chart aligned with existing business definitions. Regions, time filters, and currency formats match company reporting standards. Users can insert the chart into presentation decks or share it via link.
Significance
This aligns with market trends in modern BI. Users require immediate answers and consistent results. The Visualization Assistant balances speed with structure. Many conversational tools lack this balance.
This capability enables business users to obtain results quickly without manual configuration.
2.2 Code Interpreter:
The Code Interpreter introduces reasoning support in Looker.
Scenario
A finance lead observes a gross margin difference between March and February. Instead of extracting multiple reports, they query: “Why did margins change in March?”
The Code Interpreter applies Python logic to analyze contributing factors. It identifies insights such as product mix shifts, campaign discounts, or supplier cost variations. The response explains the logic in plain language and provides supporting data.
Team Application
This approach aligns with current BI trends: shifting from static reports to dynamic insight generation. Users request explanations, not just values.
2.3 Formula Assistant
Calculated fields appear in most BI workflows. The Formula Assistant simplifies creation and supports collaboration.
Example
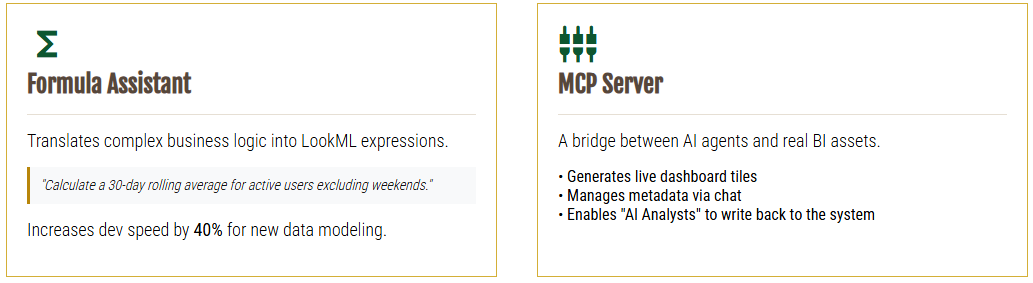
A marketing analyst defines “Net Campaign Revenue” as revenue minus refunds and promotional credits. The analyst describes the logic in plain language instead of writing and testing expressions manually.
Looker generates a LookML expression that aligns with the semantic layer. Users reuse the metric in dashboards, explorers, and conversations.
Impact at Scale
Looker standardizes calculations. This ensures consistent results. Teams share a single definition. This reduces confusion. It improves alignment across the organization.
2.4 Conversational Analytics in Slack and Collaboration Tools
Looker delivers conversational analytics within existing collaboration platforms. Users access insights in their current workflow. No context switching is required.
Explore Looker Embedded Analytics. Move insights from dashboards to proprietary software or Slack workflows.
Real-time collaboration case study
During a Slack discussion on customer retention, a user asks: "How did churn look for enterprise customers last month compared to the previous quarter?"
Looker responds in the thread with a summary and a link to the source data. All participants view the same figures based on consistent definitions. This removes the need for side discussions, screenshots, or follow-up emails.
Alignment with modern BI usage
Embedded conversational analytics supports this shift.
This is a core component of our Conversational Analytics Solutions.
2.5 MCP Server: Conversational requests create assets
The Model Context Protocol (MCP) Server extends conversational analytics from answering questions to executing actions.
Real-time use case
A data team uses an AI assistant connected to Looker via MCP. A product manager asks: “Create a dashboard showing monthly active users, new signups, and churn for the last year.”
The assistant queries Looker via API. It selects Explores, builds the dashboard, and returns a live link. The initial query becomes a shared analytics asset.
Differentiators
Conversational features in many BI tools stop at the response. Looker generates dashboards, reports, and reusable content. This pattern aligns with trends in advanced BI platforms noted in ecosystem comparisons.
3. Looker's role in conversational BI
Many conversational BI tools simplify query input. Looker also ensures answer reliability.
Conversations run on the LookML semantic layer. Metrics such as revenue, margin, or active users retain the same definition across all views. This consistency builds trust when sharing insights across departments. Analysts reduce time spent reconciling data. Business users gain confidence in the results.
This approach supports Looker's design for shared understanding rather than individual analysis. Explore our guide on Business Intelligence Migration.
4. Comparison of conversational BI tools
| Tool | Conversational approach | Governance model | Typical use |
|---|---|---|---|
| Tableau | Natural language to visuals | Moderate | Exploratory analysis |
| Looker | Conversation on semantic layer | High | Enterprise BI |
| Domo | Chat with alerts and summaries | Moderate | Operational insights |
| Qlik | Conversational discovery | Moderate | Relationship analysis |
| Power BI | Q&A driven visuals | Moderate | Business reporting |
| Splunk | Conversational queries on logs | High | IT and security |
5. Conclusion: Value of the Looker approach
Conversational analytics performs best when it mirrors organizational thinking and operations. Looker combines natural language interaction with a governed semantic layer. It includes embedded collaboration and AI-driven workflows.
Conversational embedding, the MCP Server, Visualization Assistant, and Formula Assistant support the shift from question to answer to action. These tools enable consistent definitions, shared understanding, and scalable analytics.
As conversational analytics spreads, platforms that balance ease of use with clarity and trust will matter most. Looker’s feature set supports both everyday questions and enterprise-level decision-making.
Related guides: what is conversational analytics, and what AI-driven analytics in Looker means for business users.